Market Moves • Thursday 28 May 2026 • Post-Close
Wednesday 28 May was supposed to be a quiet FOMC-Minutes day. Instead the session delivered four headline events in sequence: crude oil crashed $4.18 on a single geopolitical shift, Kevin Warsh was sworn in as Federal Reserve Chair replacing Jerome Powell, Trump threatened to walk away from the Iran deal entirely, and equity indices closed at back-to-back records even as the rest of the asset grid declined. Thursday’s Core PCE lands at 08:30 EDT and every positioning decision today was made in reference to that number. The setup going in is more complicated than the record close suggests. This is what Wednesday actually meant.
Market Moves Core Read
Four events defined Wednesday: the crude collapse removed the most visible inflation input just before PCE, Warsh’s arrival reprices Fed credibility risk upward, Trump’s Iran conditions introduced a binary back into geopolitics that the morning had priced as resolved, and the record close in the Dow and S&P concealed a session where tech fell, energy crashed, and breadth was absent. The macro conditions our analysis mapped this morning, and the multi-asset divergence the global grid captured, now have a narrative explanation. Markets rose on fewer signals than the headlines imply. Thursday’s PCE either confirms the disinflationary bet or unwinds it simultaneously across four asset classes.
Crude Crashed 4.45% Because of Iran
The one macro input that matters most for inflation expectations
Crude oil closed at $89.71, down $4.18 from Tuesday’s $93.89. That is not a modest pullback. That is the fifth straight losing session, and it erases the majority of the geopolitical premium that built up when the Strait of Hormuz closed following the outbreak of the Iran conflict in April.
The catalyst was diplomatic language. Reports emerged Wednesday morning that an Iran deal was “largely negotiated.” The market repriced oil instantly. If sanctions ease, Iranian supply returns to the market. The Strait reopens. The roughly $8-10 of geopolitical premium that had been baked into crude prices since April begins to deflate.
This matters enormously for PCE Thursday. Crude feeds into energy CPI with a lag, but the direction of travel is now unambiguous to the bond market. The 10-year yield rallied, as the macro read we published this morning traced. Bonds were already bidding into a disinflationary setup. Crude’s crash confirmed that bet hours before the close.
Then Trump complicated it. Late in the US session, he released a statement saying he is “not sure we should make the deal” with Iran if Saudi Arabia, the UAE, Qatar and other regional partners do not join the Abraham Accords. The preliminary diplomatic progress was being held conditional on a broader regional framework.
The crude market did not reverse hard on that statement. But the geopolitical risk premium, which was being systematically bled out of the oil price all day, stopped falling quite so cleanly. That ambiguity is what makes the Iran situation the most load-bearing news event for the rest of the week.
| Energy Instrument | Close | Day Change | 5-Day Move | Driver |
|---|---|---|---|---|
| WTI Crude | $89.71 | -4.45% | 5th losing session | Iran deal “largely negotiated” deflates geopolitical premium |
| Energy sector (XLE) | — | -1.49% | Worst sector Wed | Direct pass-through from crude move |
| Japan crude imports | 900K bbl/day | -59% MoM | April data | Strait of Hormuz closure impact; 90%+ ME dependency |
| Iran deal status | Uncertain | Conditional | Trump caveat late session | Abraham Accords conditions added by Trump |
The Japan number deserves a sentence on its own. Japan’s crude oil imports fell 59% month-on-month to 900,000 barrels per day in April. Japan relies on the Middle East for over 90% of its crude. This is what a Strait of Hormuz closure looks like in real import data. It is not abstract geopolitical theory. It is a 59% supply shock in the world’s fourth-largest economy, visible in the April figures.
If the Iran deal closes, Japan’s energy crisis partially resolves. If Trump’s conditions derail it, the supply disruption persists and the disinflationary crude story reverses. That is why Thursday’s geopolitical follow-through matters almost as much as PCE itself.
Kevin Warsh Is Now the Federal Reserve Chair
The most consequential institutional change in US monetary policy in years
Wednesday’s second major story was structural rather than market-moving in the short term. Kevin Warsh was sworn in as Federal Reserve Chair, replacing Jerome Powell. This is not a cosmetic change.
Warsh has historically been more hawkish than Powell’s post-2021 framework. He is a former Fed governor who dissented on the pace of quantitative easing during the 2008-2012 period and has consistently argued for a more rules-based approach to monetary policy. His arrival in the Chair position, on the morning before a Core PCE print, is a layering of institutional uncertainty onto an already binary data event.
The market did not price a dramatic reaction Wednesday. That is telling. It suggests one of two readings: either institutions believe the Fed’s institutional inertia is strong enough that Chair transitions do not immediately change policy direction, or they have already discounted a more hawkish Fed into forward rates and the 2-year yield at 3.585% reflects that.
But the medium-term consequence is clearer. Warsh is inheriting a situation where inflation has not definitively returned to target, the yield curve is still inverted in parts, and the 30-year Treasury is trading above 5.0% as the term premium analysis in our macro read confirmed. His first public communication as Chair will be watched more carefully than anything Powell said in his final sessions.
This is also the context in which Thursday’s PCE lands. A soft print under a new Chair might accelerate rate cut expectations faster than it would have under Powell, because markets will be testing Warsh’s reaction function immediately. A hot print under a new Chair creates a different kind of uncertainty: will he lean more hawkish than his predecessor, or maintain continuity? The first data point of the Warsh era lands in fewer than 12 hours of this writing.
Back-to-Back Records: What the Headline Is Not Saying
Wednesday 28 May 2026 equity close
The S&P 500 closed at 7,520. The Dow closed at 50,644. Both at all-time highs for the second consecutive session. On the surface, this is unambiguously bullish tape.
Below the surface, the global grid analysis we published today captured the divergence precisely. The Nasdaq 100 fell 0.09% on the same session. The Russell 2000 was flat. Europe sat out entirely. Asia held but did not break out. The records came from the Dow and S&P, carried by value-tilted, defensive names rather than the growth engine that typically defines the strongest bull-market sessions.
The sector breakdown is the tell. Consumer Staples rose 1.14% Wednesday. Consumer Discretionary posted its fifth consecutive up session. Technology fell 0.38%. Energy dropped 1.49%. This is a market rotating out of growth and out of commodities, not one pressing into risk. It is the positioning signature of institutional caution ahead of a known binary, not conviction buying at all-time highs.
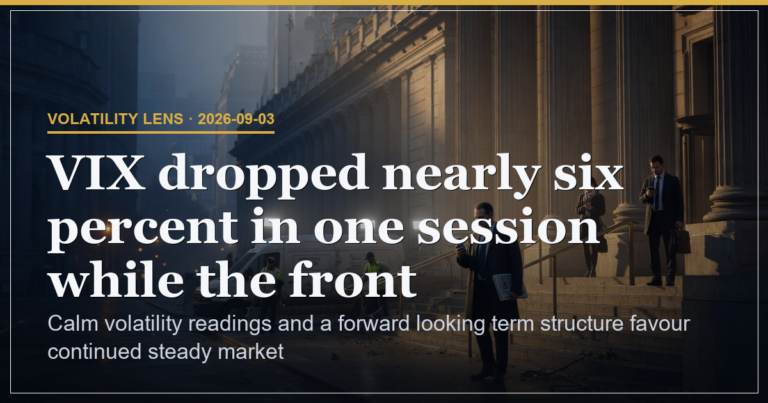
VIX closed at 16.29, down from 17.01. That 4.23% compression in implied volatility means two things simultaneously. Options are pricing lower risk going into PCE. And protection is cheap. If the print surprises to the upside on inflation, the VIX re-expansion from 16 will be abrupt.
| Index / Instrument | Close | Day Change | Record? | Signal |
|---|---|---|---|---|
| S&P 500 | 7,520.36 | +0.02% | All-time high | Carried by large-cap value; thin breadth |
| Dow Jones | 50,644.28 | +0.36% | All-time high | Airlines, industrials, defensive names driving |
| Nasdaq 100 | 29,973.57 | -0.09% | No record | Tech lagged; the divergence the grid flagged |
| Russell 2000 | 2,919.94 | -0.02% | No record | Small-cap breadth absent |
| VIX | 16.29 | -4.23% | 5-day avg: 17.95 | Protection cheap; PCE binary unpriced |
| XLE (Energy) | — | -1.49% | Worst sector | Crude collapse passed through immediately |
| XLP (Consumer Staples) | — | +1.14% | Best sector | Defensive rotation before PCE event |
The read says this is a bull market. The breadth says it is a bull market running on a narrow engine. At record highs, that combination is not a problem until it is. Thursday’s PCE is the event that resolves the ambiguity.
The Data Nobody Led With: Foreclosures Up 26%, Mortgages Up
US consumer and housing stress data — week of 28 May 2026
Beneath the record closes, the US housing market is sending a different signal entirely. Properties with foreclosure filings rose 26% year-on-year in Q1 2026, reaching approximately 119,000, the highest level in six years. The last time foreclosures were this elevated was Q1 2020, just before emergency government relief suppressed the figures for two years.
Simultaneously, home prices across America’s 20 largest cities fell 0.16% month-on-month in March, the second consecutive monthly decline after six straight monthly increases. Year-on-year, prices rose only 0.83%, the weakest annual gain since July 2023. Over half of the 20 major US housing markets are now showing price softness.
The mortgage market reinforced the stress. The MBA 30-year mortgage rate rose to 6.65% for the week of 22 May, up from 6.56% the prior week. MBA applications dropped 8.5%, after a -2.3% the prior week. That is two consecutive weeks of falling applications accelerating to the downside, with rates rising.
This is the tension the analysis must hold explicitly. The equity market made all-time highs. The housing market is in its weakest price growth in nearly three years with foreclosures at a six-year high and applications falling. These are not compatible pictures of an economy at full health. They are compatible pictures of a K-shaped recovery where financial assets reflect Fed liquidity and lower-income households reflect the cost of the 2022-2024 rate regime.
| Housing / Mortgage Indicator | Reading | Prior | Direction | Context |
|---|---|---|---|---|
| Foreclosure filings Q1 2026 | ~119,000 | 6yr low trend | +26% YoY | Highest since Q1 2020; pre-stimulus level |
| 20-city home prices MoM (Mar) | -0.16% | -0.XX% Feb | 2nd consec. decline | After 6 straight monthly increases |
| 20-city home prices YoY (Mar) | +0.83% | Higher | Weakest since Jul 2023 | Over half of 20 major markets declining |
| MBA 30-yr mortgage rate | 6.65% | 6.56% | +9bps WoW | Rising into soft application demand |
| MBA mortgage applications | -8.5% | -2.3% | Accelerating lower | 2 consecutive weeks of declines |
| Wall St tech CDS notional | $12.5B | $11.5B start Q2 | +$1.0B Q2 to date | Record; institutions hedging Big Tech credit |
Wall Street is simultaneously hedging Big Tech credit risk at record levels. The total net notional value of credit default swaps on major technology firms reached $12.5 billion in Q2 2026, up $1.0 billion from the start of the quarter, a new record. The same institutions whose equity desks are watching S&P records are insuring against tech corporate debt failures at unprecedented scale. That is the kind of cognitive dissonance that only survives until a catalyst resolves it.
Japan, Australia, and the Global Rate Repricing
International data — Wednesday 28 May 2026
The macro read we published this morning flagged the Japan 40-year JGB auction as a critical signal. It cleared at 3.840%, up from 3.600% at the prior auction. That is a 24 basis point jump on ultra-long Japanese government paper. In a country that has been the world’s largest holder of US Treasuries for years, stress at the ultra-long end of Japan’s own curve is a global rates event, not a local one.
The reason the JGB auction matters specifically this week: the Bank of Japan is navigating the same question every other major central bank is navigating, with the added complication that it is doing so from a starting position of near-zero rates that the rest of the world normalised from three years ago. Japan’s bond market is catching up to a new normal. That catch-up process has spillovers into global yields, the yen, and the carry trade infrastructure that funds a significant portion of global risk positions.
Australia confirmed a separate disinflationary signal. Australia’s inflation rate came in at 4.2% year-on-year for April, below the prior 4.6% and below the 4.4% consensus. The trimmed mean, which the Reserve Bank of Australia targets, held at 3.4% year-on-year. These are not market-moving numbers for global assets, but they are directionally consistent with the thesis that inflation is coming down globally, not just in the US. That consistency is what the bond market is betting on ahead of PCE.
The ECB published its Financial Stability Review on the same morning. No specific shock signals emerged, but the timing — a stability review day before a US inflation print while the new Fed Chair is being sworn in — is the kind of overlapping institutional noise that keeps risk premiums elevated even when individual data points are benign.
| Region / Event | Reading | Prior / Expected | Global Significance |
|---|---|---|---|
| Japan 40-yr JGB yield | 3.840% | 3.600% prior | +24 bps auction jump; global duration pressure |
| Australia CPI YoY (Apr) | 4.2% | 4.4% expected / 4.6% prior | Below consensus: global disinflation confirmed |
| RBA Trimmed Mean CPI YoY | 3.4% | 3.4% expected | In-line with target path; RBA cut window opens |
| China Industrial Profits YTD YoY | +18.2% | +12.0% expected | Significant beat; China manufacturing recovery signal |
| UK Gilt 2033 auction | 4.550% | 4.507% prior | Higher clearing rate; UK fiscal premium persists |
| Germany 30-yr Bund | 3.50% | 3.62% prior | Lower clearing; European duration slightly bid |
| USD/JPY | 159.50 | +0.16% day | Yen weakening despite JGB stress; carry pressure |
China’s industrial profits rising 18.2% year-to-date against a 12.0% consensus expectation is the positive surprise of the day that markets largely ignored. China’s manufacturing sector is recovering faster than expected. In a world pricing Iranian supply disruption and a crude crash simultaneously, the China growth signal is the data point that does not fit the prevailing narrative. We are watching it.
The FOMC Minutes Were a Non-Event. That Itself Is the Signal.
Fed communication context
The FOMC Minutes from the May meeting were released Wednesday afternoon. Markets did not move. Analysts did not flag new language. The minutes contained no surprises about the pace or direction of the rate path.
In a normal week, that would be the story: a steady Fed, a calm market, nothing to reprice. Wednesday was not a normal week. Kevin Warsh was sworn in as Chair on the same day. The minutes reflected Powell’s committee. The first communication from Warsh’s committee will be the one that actually matters for rate path expectations.
The minutes’ non-event status means the market is going into PCE Thursday with no new Fed guidance, a new Chair whose policy preferences are more hawkish than his predecessor, and an inflation print that will be the first real test of how quickly Warsh’s team signals its reaction function.
This is why the sentiment data matters. The AAII survey shows 43.6% bearish and 31.7% bullish, against historical averages of 31.0% and 37.5% respectively. Individual investors are more pessimistic than their historical baseline even as equity indices make records. The crowd is not buying the record. The institutions are. When the crowd is this sceptical at highs, one of two outcomes resolves it: a catalyst confirms the bull thesis and sentiment normalises, or the institutions prove the crowd right and start selling. PCE is that catalyst.
The Tension We Are Holding Going Into Thursday
One honest admission of uncertainty
The read says risk-on. The evidence says record closes, VIX at 16.29, crude deflating, bonds bidding, Australia confirming global disinflation. Every macro input we track is pointing at a soft PCE print and a continuation of the current regime.
But the counter-evidence is not trivial. Foreclosures are at a six-year high. Home prices have turned negative month-on-month for the second consecutive time. Mortgage applications are accelerating lower. Wall Street is hedging Big Tech credit risk at record levels. The AAII survey shows retail investors are more bearish than their historical average even at all-time highs. Iran’s deal is now conditional on conditions that were not in the market this morning. And the new Fed Chair’s first policy signal is unknown.
We hold that tension explicitly. The record closes are real. The stress indicators are real. Both exist simultaneously because we are at the late stage of a macro cycle where financial assets reflect central bank accommodation and economic fundamentals reflect the consequence of the rates that preceded the accommodation. Eventually those two pictures reconcile. The honest admission is: we do not know if Thursday’s PCE is the moment of reconciliation, or another deferral.
What we do know: the positioning going in is one-sided. Bonds bid, dollar flat, VIX compressed, crude deflated. If PCE surprises hot, all of that unwinds simultaneously. That asymmetry is what defines the risk of this session, not the direction of the base case.
How We Are Preparing: Three Scenarios Into Friday
PCE Thursday 08:30 EDT — scenario framework
PCE is referenced five times across the analysis today because it is the binary that every other piece of this session was positioned around. Here is how Thursday resolves depending on the print.
| Scenario | Probability | PCE Print | Market Read | What We Watch |
|---|---|---|---|---|
| Bull | 45% | 2.4% or below core | Bonds rally, dollar drops, S&P extends records, Nasdaq resumes leadership. Summer cut narrative confirmed. Warsh’s arrival priced as continuity. | NDX reclaims 30,000; VIX below 15.50; crude stabilises above $88 |
| Sideways | 30% | 2.5%-2.6% core | In-line print. Markets digest. Equities hold records but do not extend. VIX stays compressed. Bond bid fades but does not sell off. Dollar drifts higher slightly. No directional clarity into Memorial Day weekend. | S&P holds 7,500; 10yr yields stable at 4.48-4.52%; crude range-bounds $88-91 |
| Correction | 25% | 2.7% or above core | Bond sell-off simultaneous with equity correction. Dollar surges through 100. Dollar-short unwind hits EUR/USD, GBP/USD. VIX spikes from 16.29 toward 20+. Crude may find bid if Iran deal talks stall. Warsh’s hawkish reputation amplifies the repricing. | S&P breaks 7,490 support; 10yr yield above 4.55%; VIX 20+ intraday |
The 25% correction scenario carries disproportionate risk because of how the position is structured going into it. The bond-short unwind, dollar-short unwind, and VIX expansion from a compressed base would all happen simultaneously. That is not a 25% probability outcome with 25% damage. That is a 25% probability of 60-80% of the downside happening in the first hour of trade Thursday.
The base case is a soft print confirming the regime. But we do not allocate from the base case. We allocate with the tail risk explicitly sized. The Friday position review will tell us whether the regime confirmation held or not.
How We Are Sizing Into PCE Day
Framework guidance — not financial advice, always manage your own risk
| Allocation Tier | Context | Rationale |
|---|---|---|
| REDUCED | Pre-PCE, pre-open Thursday | Binary event with positioned markets. Entering new directional positions before 08:30 EDT is adding event risk without edge. We wait for the number. |
| STANDARD | Post-PCE soft print (45% scenario) | Regime confirmed. Risk-on signals align. Standard allocation as the multi-asset picture resolves. Watch NDX leadership return. |
| REDUCED | Post-PCE in-line print (30% scenario) | No clear directional signal. Markets hold but do not break out. Reduced allocation through the ambiguity. Wait for Friday’s session confirmation. |
| AVOID | Post-PCE hot print (25% scenario) | Simultaneous unwind across bonds, dollar shorts, and VIX. New positions in this environment absorb maximum slippage. Stand aside until the first-hour volatility resolves. |
Three-Timeframe Read: Where the Market Stands Tonight
| Timeframe | Bias | Key Catalyst | Primary Risk |
|---|---|---|---|
| Short (24-48hrs) | Conditional | PCE print at 08:30 Thursday. Iran deal follow-through. Warsh’s first public comment. | Hot PCE + Warsh hawkish signal = simultaneous multi-asset unwind from compressed volatility base |
| Medium (1-4 weeks) | Risk-on (conditional) | PCE trend confirmation. Iran deal closure and Strait reopening. Warsh continuity signals. | Housing stress and foreclosure data accelerating. Consumer slowing faster than equity prices reflect. |
| Long (3-6 months) | Cautious | Rate cut materialisation. Warsh policy framework clarity. Housing market stabilisation. | Valuations above 1929, 1965, 2000 comparisons per historical analysis. Inflation wave 2 risk if Iran deal fails and crude reverses. |
Continue Reading: The Full Wednesday Picture
These market moves sit inside a larger analytical framework. Each piece reads the prior and extends it.
- What the yield curve, dollar, and crude were pricing before 08:30 • Macro conditions analysis
- The multi-asset divergence map: records in equities, crash in oil, BTC left behind • Global grid analysis
- Where sentiment actually stood as the Dow hit 50,644 • Sentiment analysis
- The volatility compression that made PCE protection cheap • Volatility analysis
- Where the dark pool and institutional positioning sat going into the print • Institutional positioning
- The options market’s verdict on Thursday’s binary • Options analysis
Deepen Your Understanding
Related articles from the Titan Protect Foundry: