NVIDIA (NVDA) – Daily Read
4 October 2026 | Stock | Titan Macro Desk
$233.95
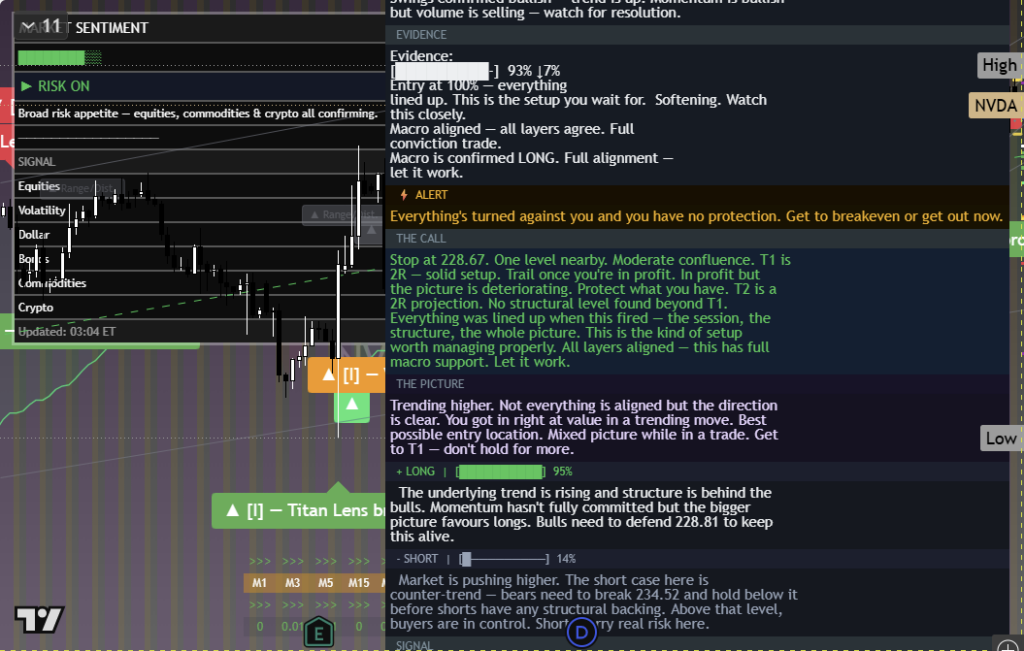
NVIDIA is testing the upper edge of its recent range with buyers still in control, but the next move must be earned through resistance rather than assumed. The last price is $233.95, 1.3 percent higher on the day, and it is pressing the top of its one-month range. That matters because the stock is close enough to a breakout to attract fresh participation, yet also close enough to established supply for failed attempts to become meaningful. The clear view is constructive while price holds the nearby handles, with confirmation required above the range high.
The broader backdrop remains a contest between confidence in artificial intelligence spending and the market’s sensitivity to growth expectations, interest rates, and elevated technology valuations. NVIDIA sits at the center of that contest, so its price action carries significance beyond a single stock. Strength can reinforce confidence across semiconductors and growth shares, while rejection can expose how much optimism is already reflected in positioning. Momentum is roughly 5.3 percent up over the last two weeks. The one month average is $224.35; price is above it, and the structure reads as a clean uptrend, price above both its one-month and longer averages. This combination says demand has remained persistent rather than dependent on a single strong session.
The immediate decision area begins at the nearer round number handle of $235.00. Buyers need to absorb offers there without allowing repeated rejection to weaken the advance. Above it, the month swing high at $237.87, about 1.7 percent above the current price, is the defining ceiling. It is also the upper boundary of the three month range of $190.01 to $237.87, so a decisive move above $237.87 would represent more than a marginal new high. It would show that supply across the entire range has been cleared and open the path toward $240.00. On the downside, $230.00 is the first nearby handle that should attract dip buyers. Holding it would preserve pressure on the highs. Losing it would not end the broader advance, but it would suggest the breakout effort has stalled and place greater weight on $224.35 as a test of trend quality. The deeper shelf of support at $211.16, about 9.7 percent below, is where the medium-term structure becomes vulnerable. That shelf is defended by prior demand and by buyers seeking a more substantial reset.
The bull path is straightforward: if NVIDIA holds $230.00, reclaims $235.00 with conviction, and then secures a decisive move above $237.87, then the market has evidence that buyers can sustain demand beyond the established range, making $240.00 the next destination. The bear path begins with rejection near the highs. If price loses $230.00 and cannot stabilize around $224.35, then momentum is cooling and a retreat toward $211.16 becomes credible. If $211.16 is lost decisively, then the support shelf has failed and $190.01 is exposed.
The principal risk to the constructive view is a sharp change in the macro appetite for richly valued growth stocks or evidence that artificial intelligence investment expectations are weakening. A sustained failure below $230.00 would challenge the near-term thesis, while losing $211.16 would invalidate the broader bullish structure. Net, NVIDIA remains in a clean uptrend and close to confirmation, but $237.87 is the line that converts strength into a genuine breakout.
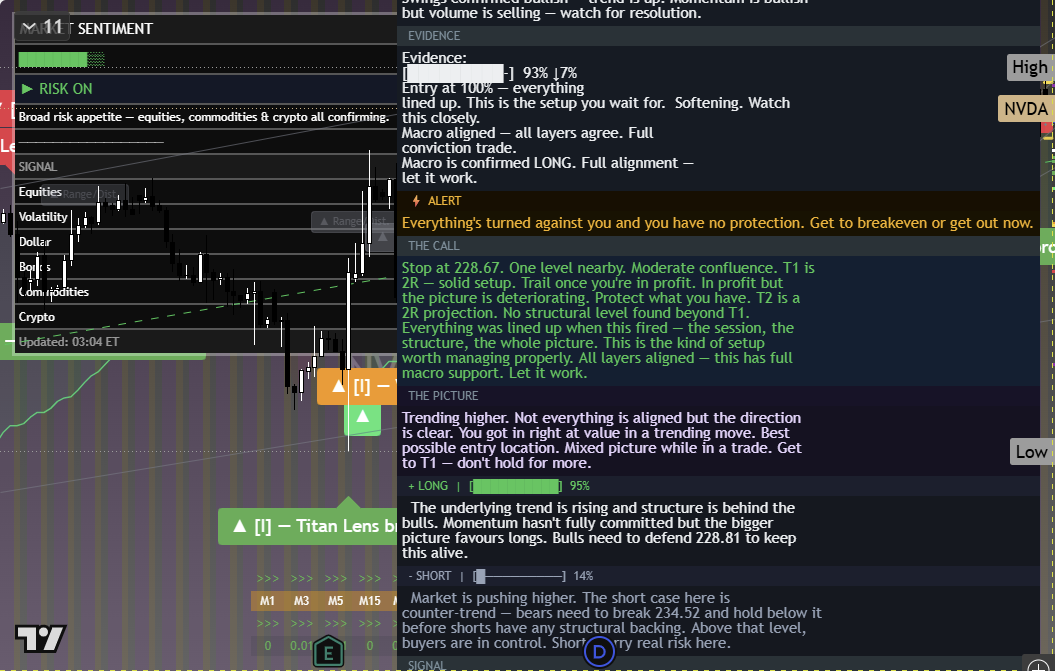
The chart above is the full daily read: structure, momentum, the levels that matter, and where the current price sits against them. Read it top to bottom for the complete picture, and pair it with our session briefs for the wider market context.
This is analysis, not financial advice. It reflects our multi-factor framework and is not a recommendation to buy or sell. Always do your own research and manage your risk.