Nikkei 225 (NKY) – Daily Read
12 September 2026 | Index | Titan Macro Desk
65,270.9
The Nikkei 225 is caught between resilient demand for Japan’s large technology franchises and a tightening macro vise, leaving the near-term bias lower until buyers reclaim lost ground. Last price is 65,271, 0.0 percent higher on the day, but the flat session masks a market still trading in the lower half of its one-month range. That matters because rallies are being sold before they can repair the structure. The clear view is defensive below the recent peak, with upside requiring proof rather than anticipation.
The global backdrop is awkward for an index heavily influenced by exporters and semiconductor leaders. Higher oil prices are reviving inflation concern, bond yields are firm, and investors are reassessing the next steps from both the Federal Reserve and the Bank of Japan. Expectations of tighter Japanese policy have supported the yen, which can reduce the translated earnings benefit enjoyed by exporters. At the same time, enthusiasm for artificial intelligence and chip shares remains the strongest counterweight. That tension explains why headline resilience can coexist with fragile breadth and sharp reversals. Momentum is roughly 1.6 percent down over the last two weeks, while the one month average is 65,660. Price is below it, and the structure reads as a downtrend, with price under both its one-month and longer averages.
The nearest battle is around the round number handles at 66,000 and 65,000. The upper handle is the first test of whether buyers can turn a bounce into acceptance above recent congestion; repeated failure there would keep sellers in control. The lower handle is the immediate psychological defense, where dip buyers should appear if confidence is intact. Below it, a shelf of support at 63,209, about 3.2 percent below, is more consequential because it marks the area where demand must halt the decline. The month swing high at 69,226, about 6.1 percent above the current price, is the decisive ceiling separating recovery from renewed expansion. The wider three month range of 60,449 to 72,618 frames the true boundaries of risk and opportunity.
The bull path is straightforward: if 65,000 holds, then a recovery through 66,000 can pull price back above 65,660 and force sellers to reassess. If that recovery develops into a decisive move above 69,226, then the path opens toward 72,618, because the market will have cleared the supply that capped the month. The bear path begins if rebounds fail beneath 66,000 and selling presses through 65,000. If the shelf at 63,209 is then lost, that exposes 60,449, as the market would have removed its last meaningful buffer before the bottom of the broader range.
The principal risk to the cautious view is a renewed semiconductor surge strong enough to overpower yen strength, oil pressure, and higher yields. Conversely, a firmer yen, another energy shock, or a hawkish policy repricing would amplify pressure on exporters and expensive growth shares. The bearish read is invalidated by sustained acceptance above 69,226, not by a brief intraday probe. The bullish path is invalidated by a clean loss of 63,209. Net, the index is not broken, but it remains vulnerable: respect support, demand confirmation above resistance, and treat rallies below the month high as repair rather than a fresh breakout.
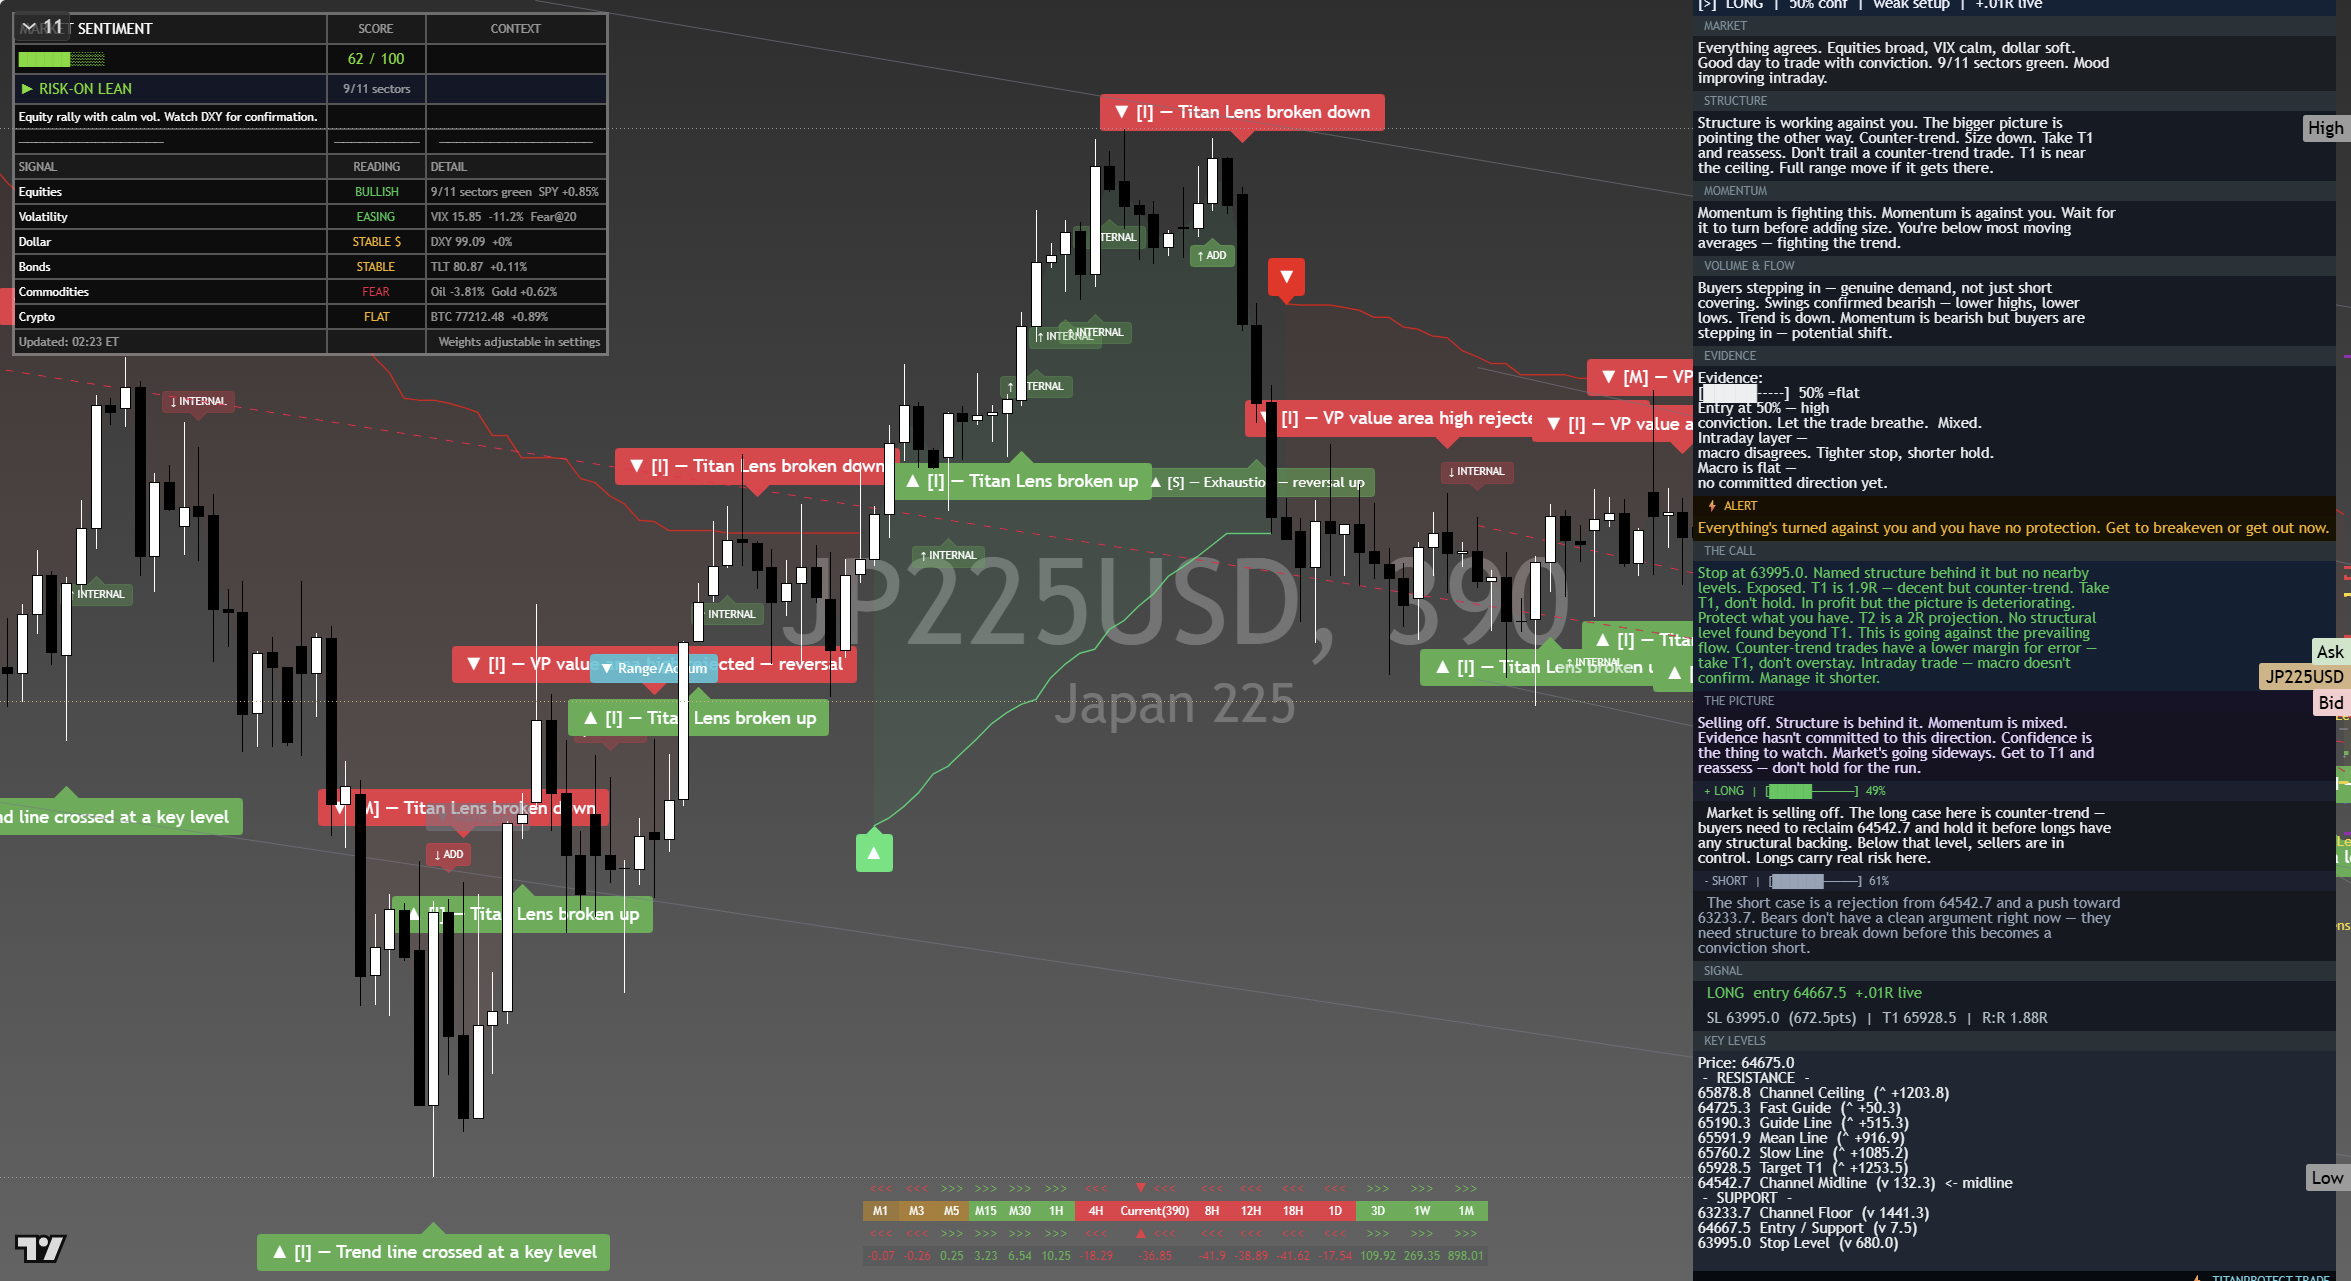
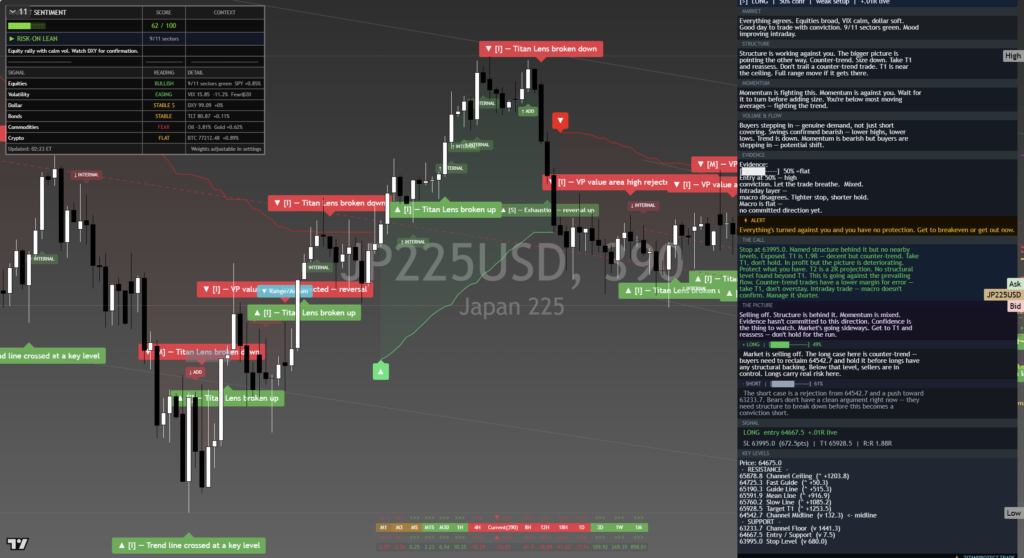
The chart above is the full daily read: structure, momentum, the levels that matter, and where the current price sits against them. Read it top to bottom for the complete picture, and pair it with our session briefs for the wider market context.
This is analysis, not financial advice. It reflects our multi-factor framework and is not a recommendation to buy or sell. Always do your own research and manage your risk.