Natural Gas – Daily Read
3 October 2026 | Commodity | Titan Macro Desk
$3.04
Natural Gas is pressing higher with credible underlying strength, but the market is not yet in breakout territory. Last price $3.04, 3.2 percent higher on the day. Momentum roughly 7.6 percent up over the last two weeks. That combination gives buyers control of the immediate tape, while the location still argues for discipline: it is sitting mid-range over the past month, leaving meaningful room in either direction. The clear view is constructive above the central pricing zone, but conviction should increase only if the market proves it can absorb supply near the upper boundary.
The macro backdrop for Natural Gas remains unusually sensitive to changing expectations around weather, storage demand, production discipline, and export flows. Those forces can reprice the commodity quickly because the physical balance matters more than broad risk appetite alone. Within that context, the current advance looks supported by improving price acceptance rather than a single isolated jump. The one month average $3.00; price is above it, and the structure reads as a clean uptrend, price above both its one-month and longer averages. That alignment matters because it suggests pullbacks are more likely to meet demand while price remains above the recent cost basis of market participants.
The nearer round number handles at $3.10 and $3.00 define the immediate contest. The $3.00 area is the first practical defense for buyers because it combines a psychological handle with the one month average $3.00. Holding it would preserve the impression that buyers are willing to pay up after the recent run. Sustained trade above $3.10 would show that the market is accepting higher prices rather than merely testing them. The month swing high $3.39, about 11.5 percent above the current price, is the decisive ceiling because it marks where the latest advance previously exhausted itself. A shelf of support at $2.75, about 9.6 percent below, is the deeper line that protects the broader bullish structure. The three month range $2.62 to $3.39 frames the full battlefield and shows why either boundary carries more weight than the noise inside it.
The bull path is straightforward: if $3.00 holds through any pullback, then buyers have a base from which to challenge $3.10. If price gains acceptance above that handle, then pressure can build toward the range ceiling. A decisive move above $3.39 opens the path toward $3.49, because clearing the established high would remove the most visible source of overhead supply. The bear path begins if rallies repeatedly fail near $3.10 and price slips back below $3.00. If that weakness develops into sustained selling, then attention shifts to $2.75. Losing $2.75 exposes $2.62 and would recast the recent strength as a failed push within the wider range.
The principal risk is that volatile shifts in physical market expectations overwhelm the constructive price structure before buyers clear resistance. The bullish read is invalidated by a sustained loss of $2.75, while the bearish case loses force if price breaks and holds above $3.39. Net, Natural Gas has an upward bias, with $3.00 acting as the near-term pivot and $3.39 as the level that converts strength into a confirmed range break.
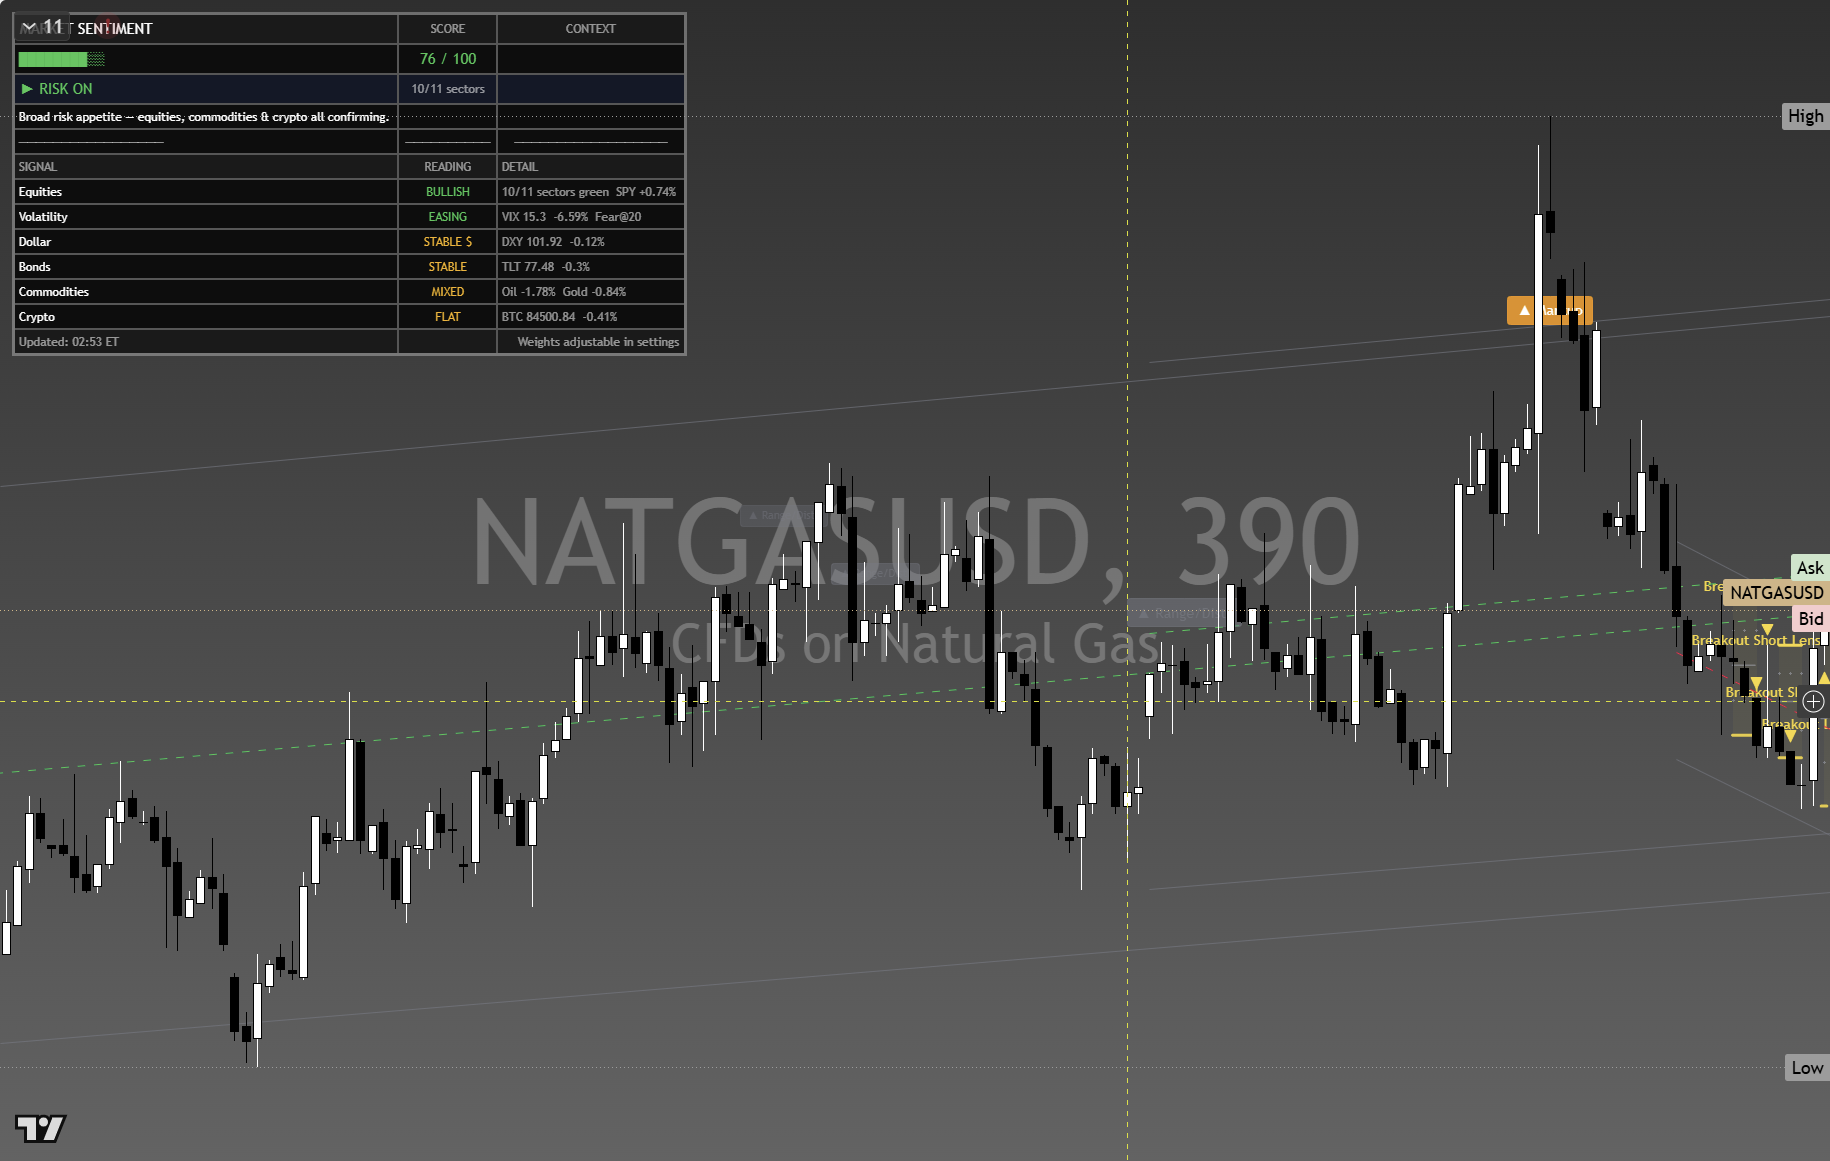
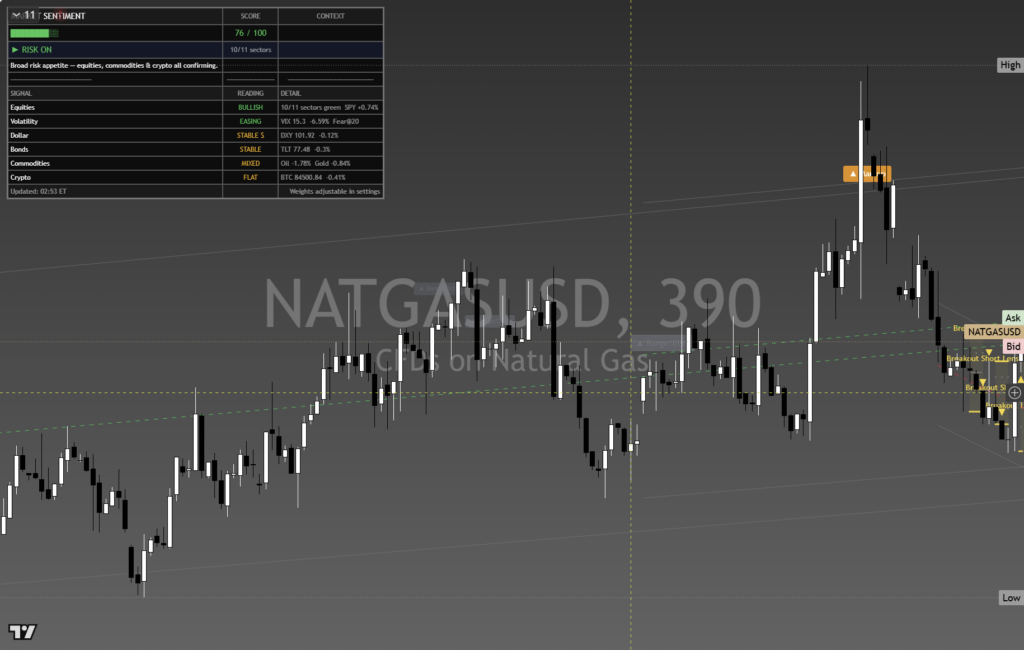
The chart above is the full daily read: structure, momentum, the levels that matter, and where the current price sits against them. Read it top to bottom for the complete picture, and pair it with our session briefs for the wider market context.
This is analysis, not financial advice. It reflects our multi-factor framework and is not a recommendation to buy or sell. Always do your own research and manage your risk.