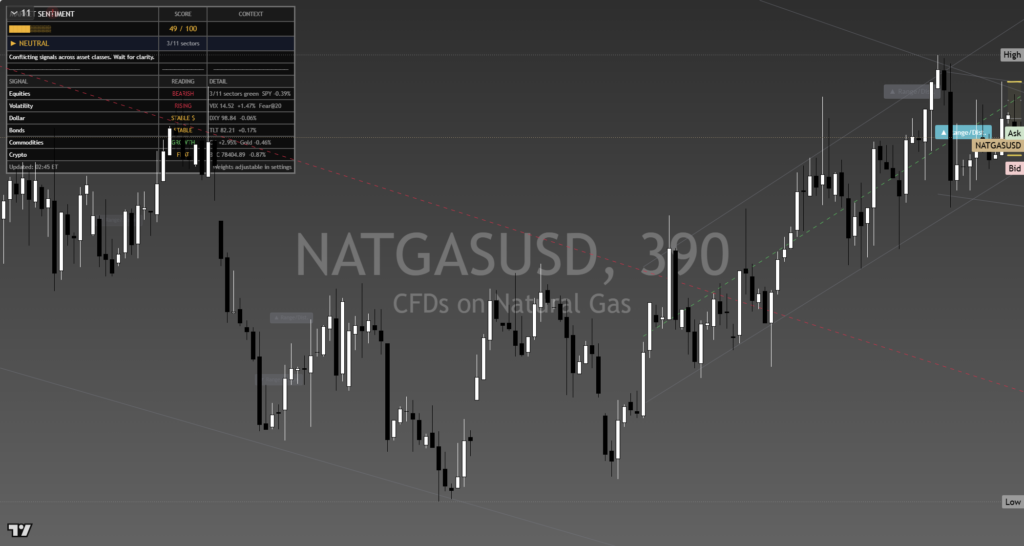
Natural Gas – Daily Read
8 September 2026 | Commodity | Titan Macro Desk
$2.95
Natural Gas is attempting to rebuild a bullish structure, but the move is not yet a clean breakout. Last price $2.95, 0.9 percent lower on the day. That setback matters less than where the market is holding: it is holding in the upper half of its one-month range. The clear view is cautiously constructive while price remains above its recent center of gravity, although abundant supply means buyers still need confirmation before the recovery can become a sustained advance.
The macro tension is between resilient demand and comfortable supply. Warm weather has supported power-sector consumption, while recovering LNG feedgas demand after export-terminal maintenance gives the market another source of pull. Against that, strong domestic production and ample storage continue to limit scarcity concerns. This leaves Natural Gas especially sensitive to changing weather expectations, LNG facility flows, and storage surprises. The broader commodity backdrop may influence positioning, but gas remains primarily a physical-balance trade. Recent price action reflects that contest: Momentum roughly 1.7 percent up over the last two weeks, yet the current daily decline shows sellers remain active near the top of the recent range. [EIA natural gas outlook](https://www.eia.gov/outlooks/steo/report/natgas.php)
One month average $2.86; price is above it, and the structure reads as a recovery attempt, back above the one-month average but still under the longer one. That makes $2.86 an important measure of whether buyers retain control of the rebound. Nearer round number handles at $2.95 and $2.90. Holding around $2.95 would show acceptance at the current price, while $2.90 is the nearer defensive line where buyers should respond if the recovery is genuine. Month swing high $3.03, about 2.7 percent above the current price. This is the immediate ceiling because it marks where the recent advance previously exhausted itself.
The wider map keeps the move in perspective. Three month range $2.62 to $3.38. A shelf of support at $2.64, about 10.5 percent below. That shelf is the major downside defense because it sits just above the range floor and represents the area where value buyers previously had reason to engage. Its distance from spot also shows that the market can absorb ordinary volatility without immediately destroying the broader base.
The bull path is straightforward: if buyers defend $2.90, reclaim firm control around $2.95, and force acceptance through the recent ceiling, then a decisive move above $3.03 opens the path toward $3.38. That would confirm the recovery has developed into a broader range expansion, with improving demand expectations overcoming the supply overhang.
The bear path begins if rallies keep failing beneath $3.03 and price slips back through $2.90. If $2.86 then fails to attract sustained buying, the recovery structure weakens and attention shifts to the deeper shelf. Losing $2.64 exposes $2.62. That outcome would signal that strong production and comfortable inventories have regained control.
The principal risk to the constructive read is softer weather-driven demand, disrupted LNG feedgas, or storage rebuilding faster than the market can absorb. Conversely, tighter balances would invalidate the bearish supply argument. Net, the recovery deserves respect above $2.86, but conviction belongs only above $3.03.
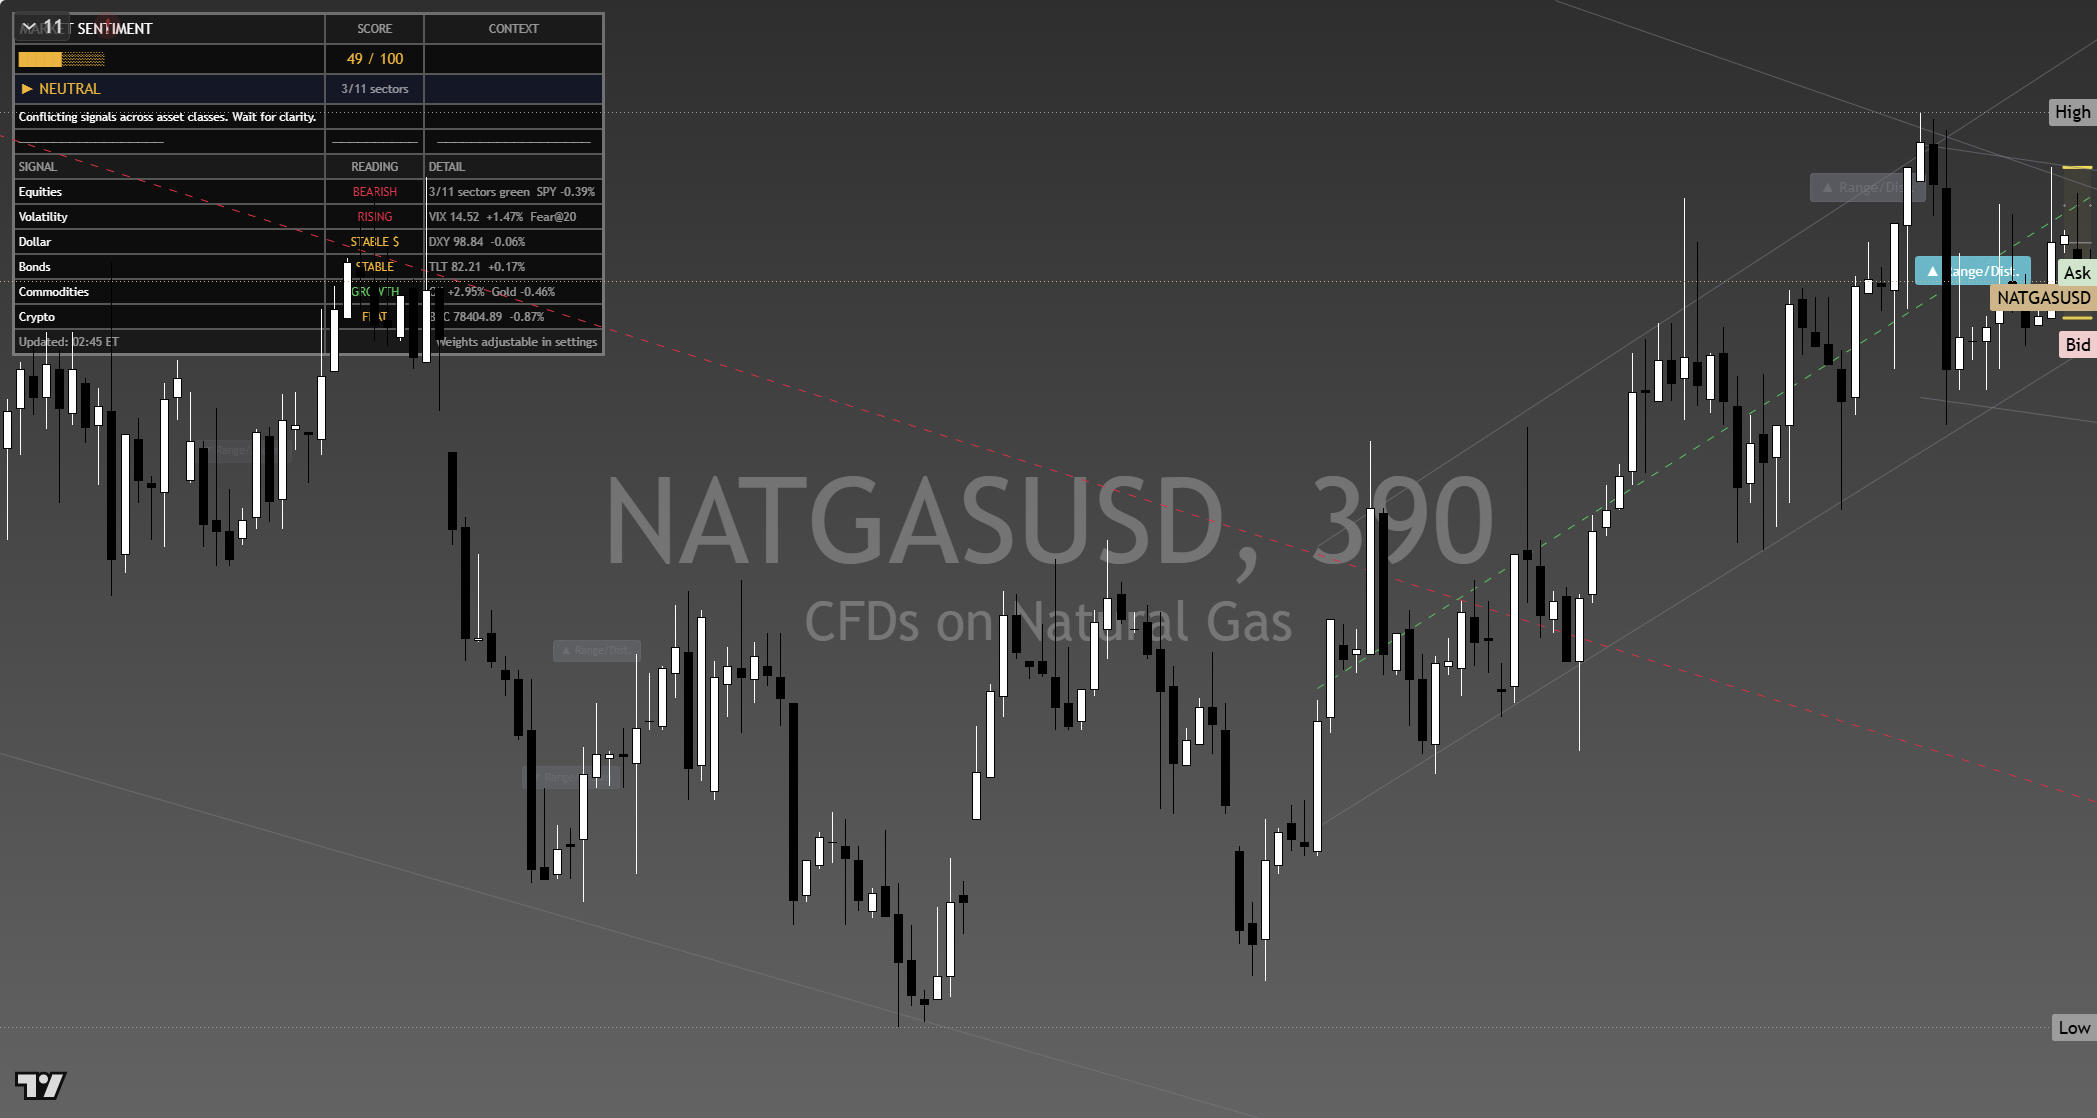
The chart above is the full daily read: structure, momentum, the levels that matter, and where the current price sits against them. Read it top to bottom for the complete picture, and pair it with our session briefs for the wider market context.
This is analysis, not financial advice. It reflects our multi-factor framework and is not a recommendation to buy or sell. Always do your own research and manage your risk.