Nasdaq 100 (NAS100) – Daily Read
13 September 2026 | Index | Titan Macro Desk
29,368.4
Nasdaq 100 (NAS100) is consolidating within an intact advance, but the market is approaching a decision point where resilience must convert into renewed upside. Last price 29,368, 0.0 percent higher on the day. That flat performance masks a constructive structure: buyers continue to absorb pressure from elevated bond yields, firmer energy costs, and uncertainty around the approaching Federal Reserve decision. The clear view is cautiously bullish while support holds, although upside conviction requires a breakout rather than continued sideways trade.
The index is sitting mid-range over the past month, which suggests balance rather than exhaustion. Technology and growth shares remain supported by confidence in earnings and artificial intelligence investment, but their valuations are sensitive to tighter financial conditions. That tension explains why the index can retain its upward structure without accelerating. Momentum roughly 1.0 percent up over the last two weeks. One month average 29,352; price is above it, and the structure reads as a clean uptrend, price above both its one-month and longer averages. The narrow margin over that average matters because it shows buyers still control the broader structure, but have little room for complacency.
The nearer round number handles at 29,500 and 29,000 define the immediate contest. Reclaiming and holding 29,500 would show that buyers are willing to add exposure despite macro uncertainty, while 29,000 should attract dip demand because it sits close to the market’s current area of value. The Month swing high 29,753, about 1.3 percent above the current price. That is the main overhead test, where prior supply and profit-taking are likely to defend the range. A shelf of support at 28,876, about 1.7 percent below. That shelf is more important than the round handle because it separates an orderly pullback from structural deterioration. The Three month range 27,176 to 30,643 provides the larger map and shows meaningful room in either direction once the present balance resolves.
The bull path is straightforward: if buyers establish acceptance above 29,500, then pressure should build against the prior swing high; a decisive move above 29,753 opens the path toward 30,643, as trapped sellers retreat and trend participants regain confidence. The bear path begins if repeated failures near 29,500 push price through 29,000. If that weakness also removes the support shelf, then losing 28,876 exposes 27,176, because the market would no longer be consolidating above value and would instead be repricing the broader advance.
The main risk is that a renewed rise in yields or another energy-driven inflation shock overwhelms technology earnings optimism. The bullish read is invalidated by sustained trade below 28,876, while the bearish case loses force if price clears 29,753 and holds there. Net, NAS100 retains a constructive bias, but buyers need to prove control above resistance; until then, this is an uptrend under macro pressure, not a completed breakout.
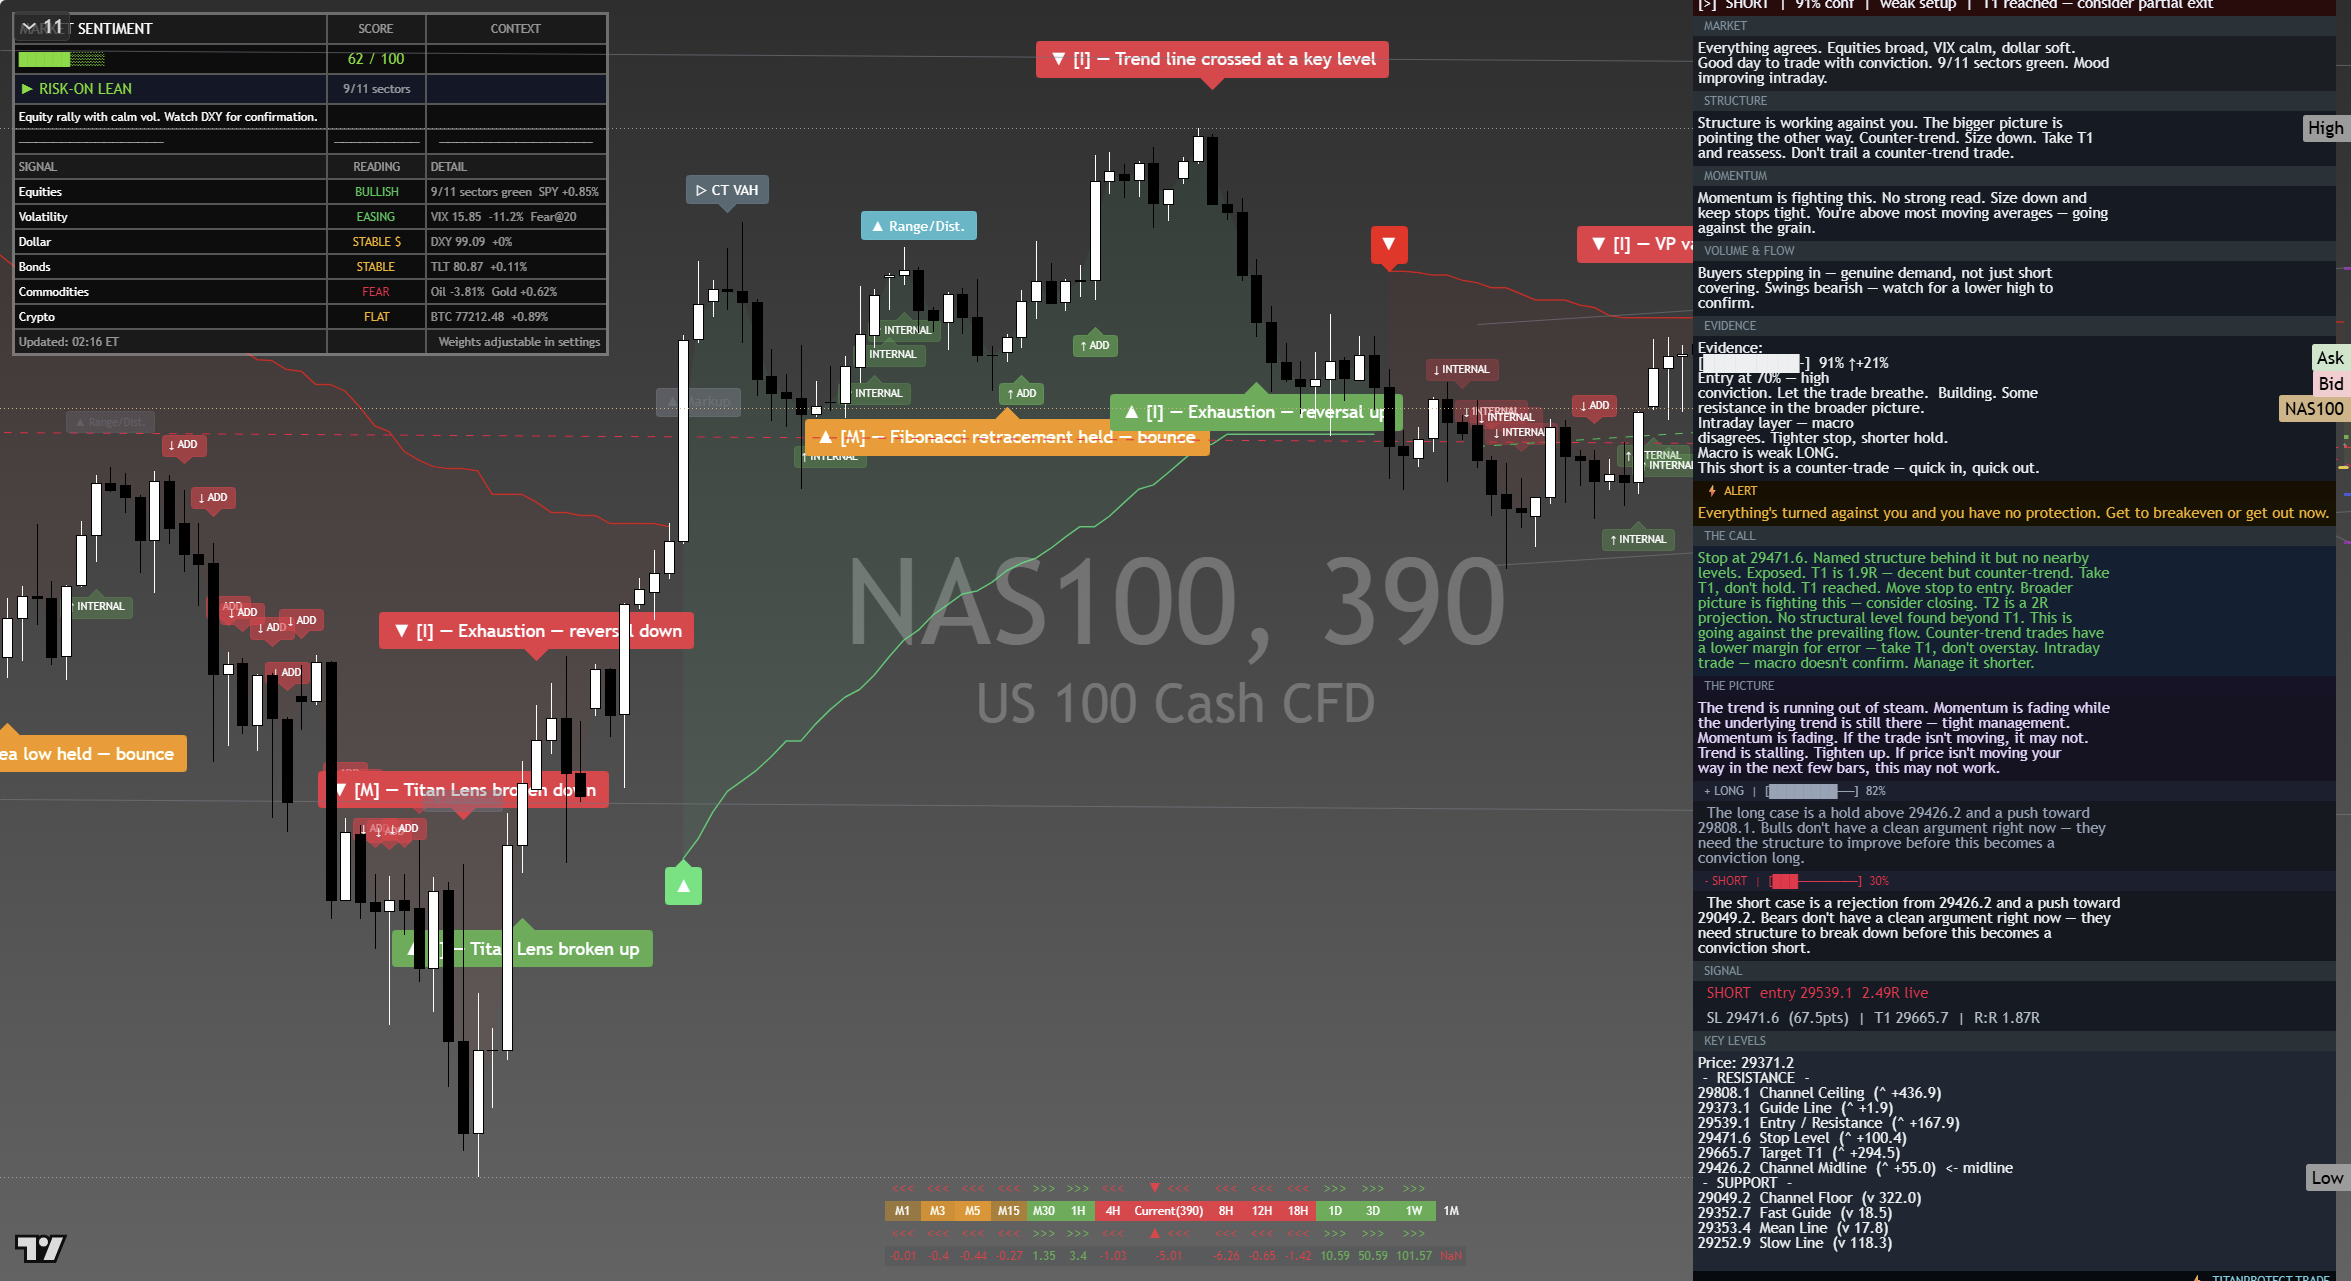
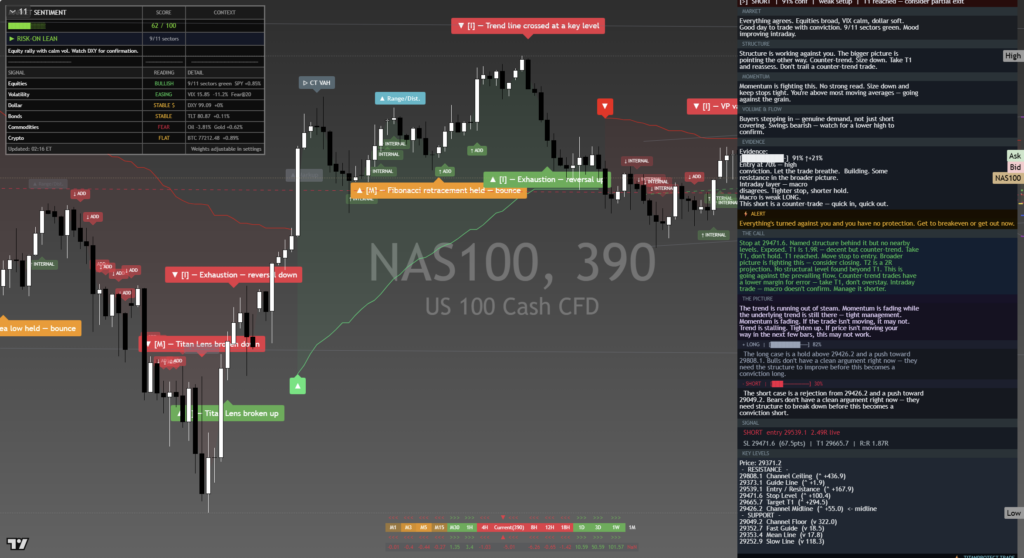
The chart above is the full daily read: structure, momentum, the levels that matter, and where the current price sits against them. Read it top to bottom for the complete picture, and pair it with our session briefs for the wider market context.
This is analysis, not financial advice. It reflects our multi-factor framework and is not a recommendation to buy or sell. Always do your own research and manage your risk.