Nasdaq 100 (NAS100) – Daily Read
9 September 2026 | Index | Titan Macro Desk
29,507.7
The Nasdaq 100 is consolidating rather than reversing, with the last price 29,508, 0.0 percent higher on the day. It is sitting mid-range over the past month, yet the broader structure remains constructive. The market is absorbing softer near-term momentum while holding above its underlying trend, which matters because consolidation near elevated levels often determines whether buyers can restart the advance or whether positioning becomes vulnerable to a deeper reset. The clear view is cautiously bullish while support holds, but conviction requires a clean escape from the recent range.
The macro backdrop remains a contest between growth expectations, inflation sensitivity, and the path of interest rates. That mix matters especially for the Nasdaq 100 because its larger growth companies are sensitive to changes in discount rates and confidence in future earnings. Company guidance, artificial intelligence spending, semiconductor demand, and the durability of technology investment are the instrument-specific catalysts. One month average 29,410; price is above it, and the structure reads as a clean uptrend, price above both its one-month and longer averages. Momentum roughly 0.5 percent down over the last two weeks. That modest loss of pace suggests digestion within the trend, but it also warns that buyers have not yet regained full control.
The nearer round number handles at 30,000 and 29,500 define the immediate contest. Holding around 29,500 keeps price anchored above the average area and signals that routine selling is being absorbed. Reclaiming 30,000 would improve confidence that demand is rebuilding. Month swing high 30,196, about 2.3 percent above the current price. That is the key ceiling because it marks where the latest advance met meaningful supply. Above it, sellers defending the monthly extreme would be forced to reassess. A shelf of support at 28,876, about 2.1 percent below. That level matters because it is the clearest downside defense for the current trend. Three month range 27,176 to 30,643. Those boundaries frame the larger balance between established demand and overhead supply.
The bull path is straightforward: if 29,500 holds, then a recovery through 30,000 can build pressure against the monthly high. A decisive move above 30,196 opens the path toward 30,643, with the breakout carrying more weight if price holds above the former ceiling rather than merely probing it. The bear path begins if repeated failures around 30,000 push price beneath 29,500. If sellers then force a sustained loss of the average area, the market can test the main shelf. Losing 28,876 exposes 27,176, because the failure would damage the uptrend and leave little supplied support from the stated range before its lower boundary.
The main risk is a sharp repricing of rate expectations, weaker earnings guidance, or fading enthusiasm toward technology investment. The bullish read is invalidated by a durable break of 28,876, while the bearish case is invalidated by acceptance above 30,196. Net, the Nasdaq 100 remains in a clean uptrend but is pausing beneath important supply. Buyers retain the advantage, although they still need to convert resilience into a confirmed breakout.
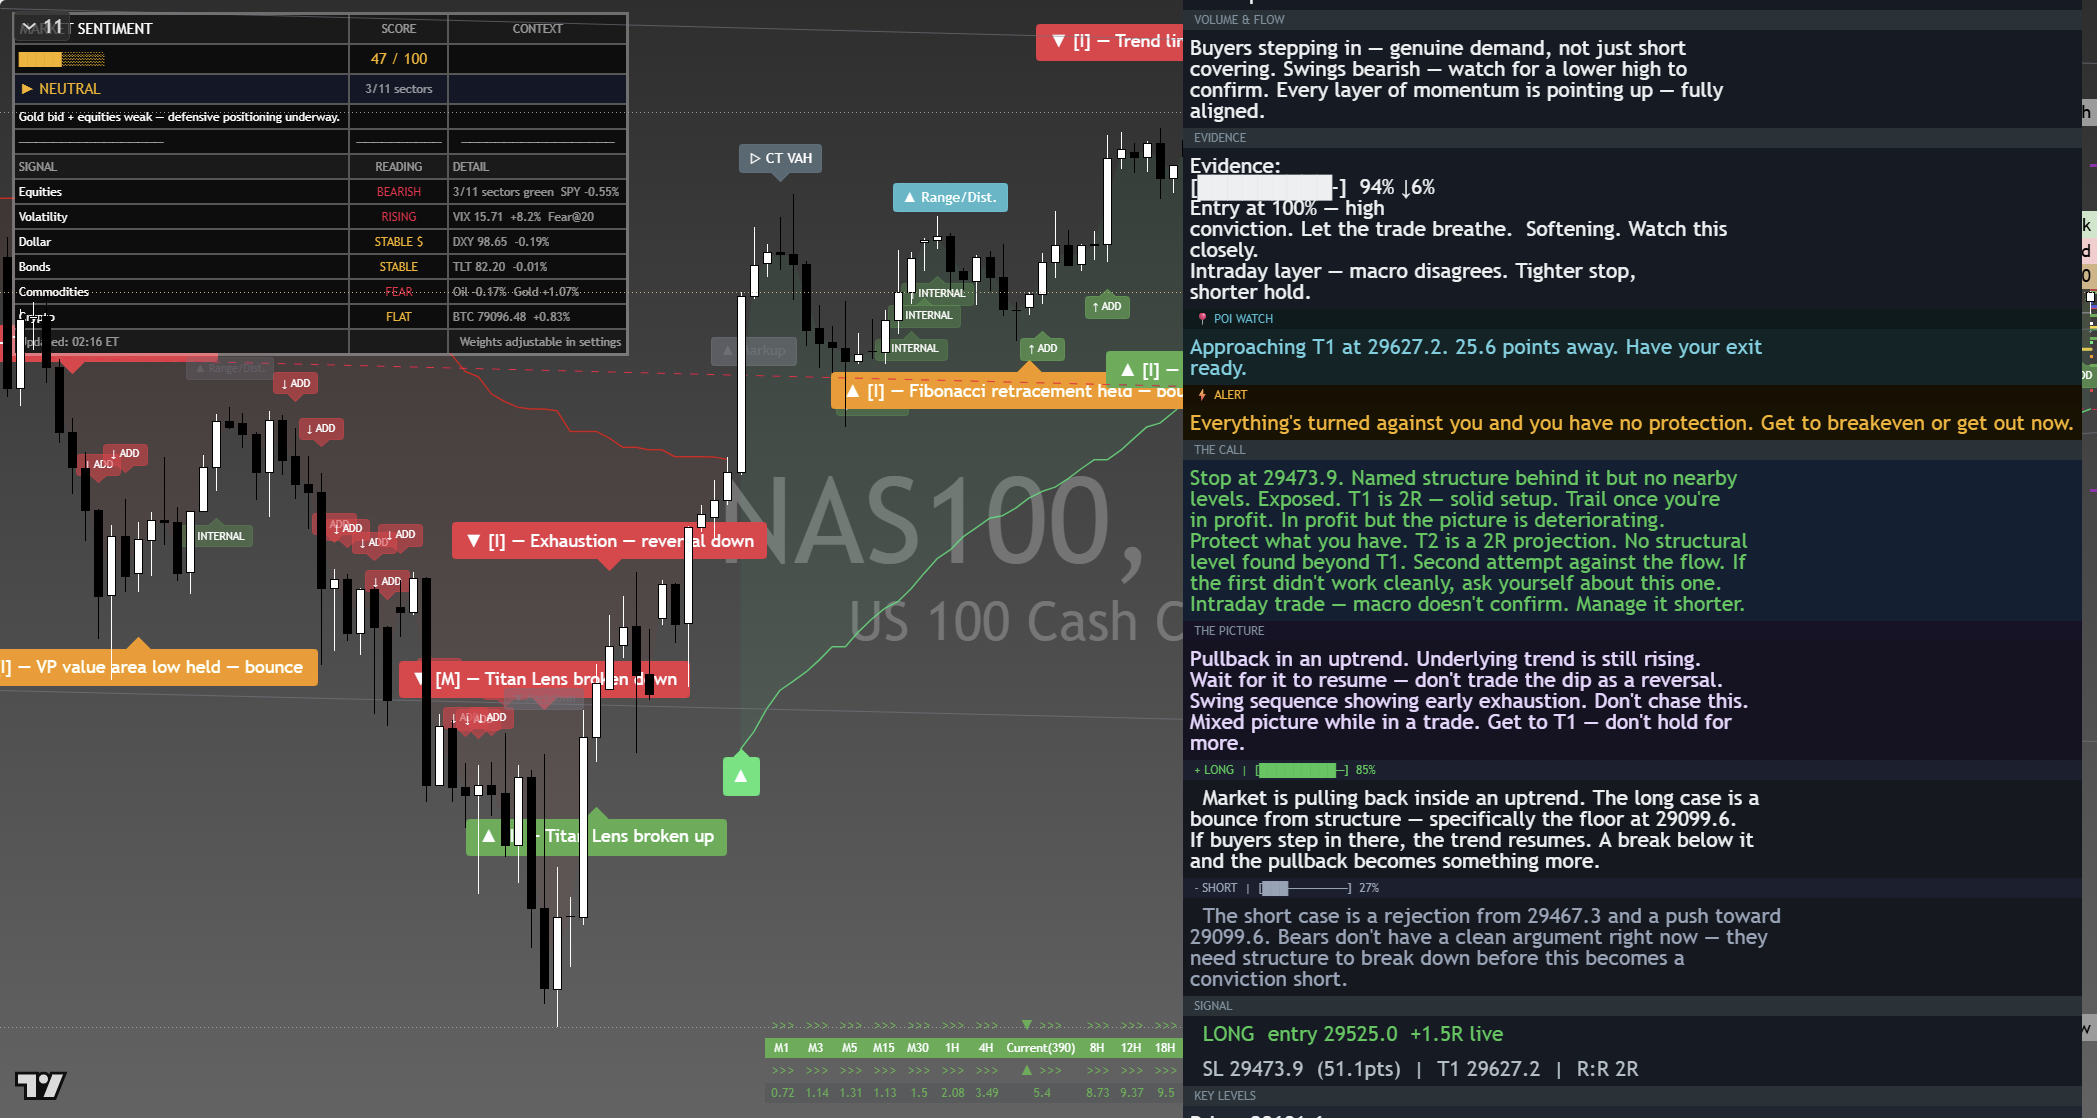
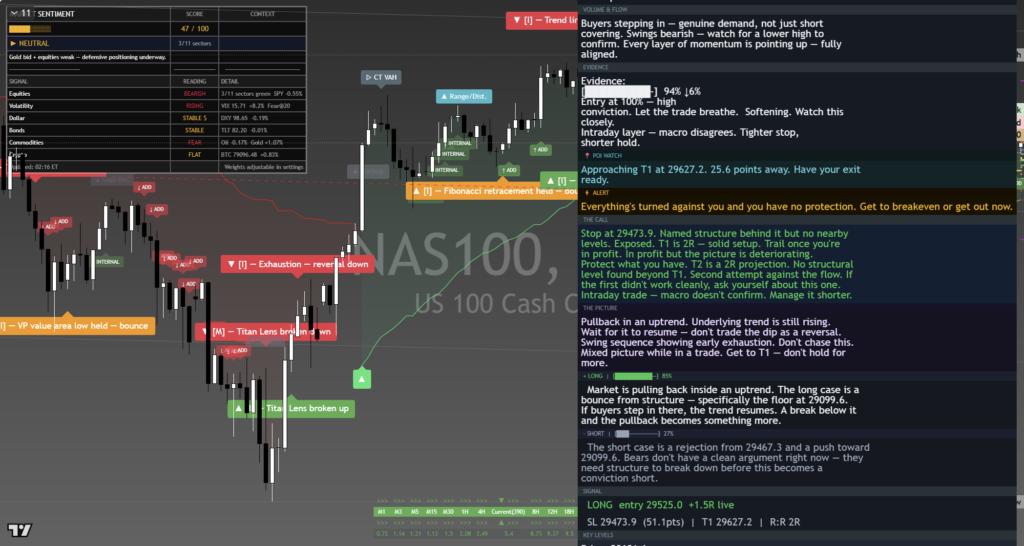
The chart above is the full daily read: structure, momentum, the levels that matter, and where the current price sits against them. Read it top to bottom for the complete picture, and pair it with our session briefs for the wider market context.
This is analysis, not financial advice. It reflects our multi-factor framework and is not a recommendation to buy or sell. Always do your own research and manage your risk.