Microsoft (MSFT) – Daily Read
4 October 2026 | Stock | Titan Macro Desk
$517.53
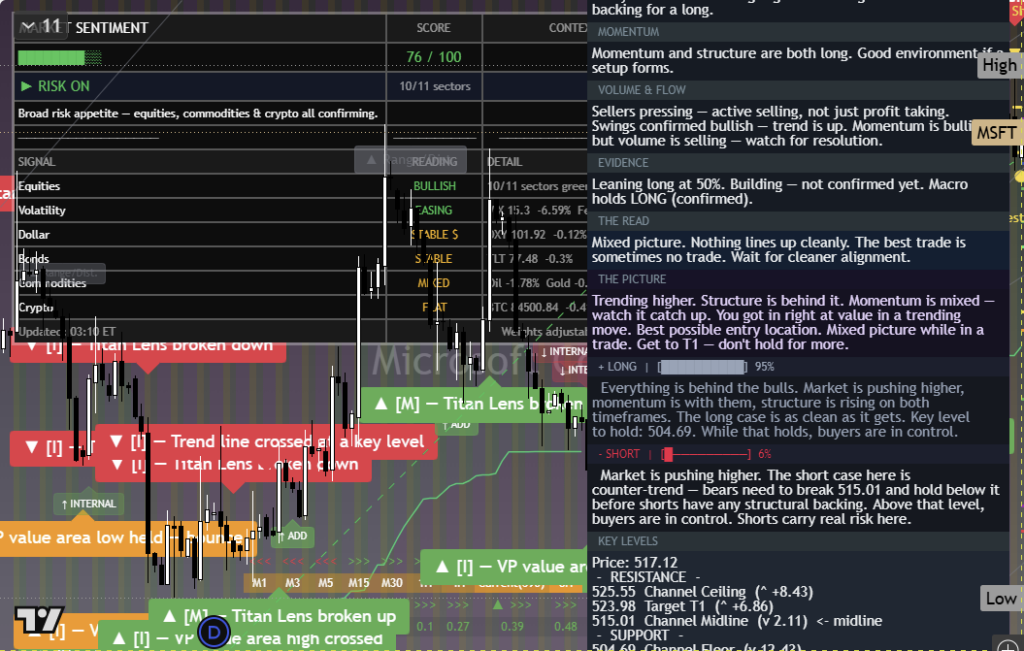
Microsoft is trading with a constructive bias, and the burden of proof remains on sellers while price holds above its recent value area. Last price $517.53, 0.9 percent higher on the day. It is pressing the top of its one-month range, which matters because sustained strength here would show that buyers are still willing to pay up rather than wait for a pullback. The clear view is bullish while nearby support holds, but the stock is close enough to resistance that confirmation is now more important than anticipation.
The broader market backdrop matters through risk appetite, growth expectations, and confidence in large technology earnings, but the immediate driver is Microsoft’s own leadership within the Stock asset class. Its scale and perceived earnings durability can attract capital when investors favor quality growth, while its valuation sensitivity can amplify any retreat in that preference. Momentum roughly 4.8 percent up over the last two weeks. That advance is firm without removing the need for fresh demand. One month average $501.09; price is above it, and the structure reads as a clean uptrend, price above both its one-month and longer averages. This alignment says buyers have controlled both the recent tape and the broader trend.
The nearer round number handles at $520.00 and $510.00 frame the immediate contest. Holding above $510.00 would preserve the sense that dips are being absorbed quickly, while repeated failure around $520.00 would suggest supply is building near the range ceiling. Month swing high $522.85, about 1.0 percent above the current price. That is the decisive resistance because it marks the point where the recent advance previously stopped. A decisive move above $522.85 opens the path toward $530.00, with acceptance above the old high signaling that sellers have been cleared rather than merely tested.
Below, a shelf of support at $486.00, about 6.1 percent below. This area should be defended by buyers who missed the advance and by existing holders protecting the trend. Losing it would represent more than routine volatility because it would break the shelf underpinning the current structure. Three month range $355.43 to $522.85. The width of that range highlights both the strength already delivered and the downside air pocket that could emerge if confidence fails. Losing $486.00 exposes $355.43.
The bull path is straightforward: if Microsoft holds $510.00, converts $520.00 from resistance into support, and then secures a decisive move above $522.85, then continuation toward $530.00 becomes the higher-probability path as breakout buyers join and trapped sellers retreat. The bear path begins if rejection near the high forces price back through $510.00. If selling then carries through $501.09 and buyers fail to defend $486.00, the trend has materially weakened and the lower boundary at $355.43 becomes exposed.
The main risk to the bullish read is a failed breakout combined with broad de-risking in growth stocks. Invalidation is not a brief pause near resistance, but sustained acceptance below $486.00. Net, Microsoft remains a buy-the-dip structure with upside control intact, though the next clean signal must come from price proving it can hold beyond the range ceiling.
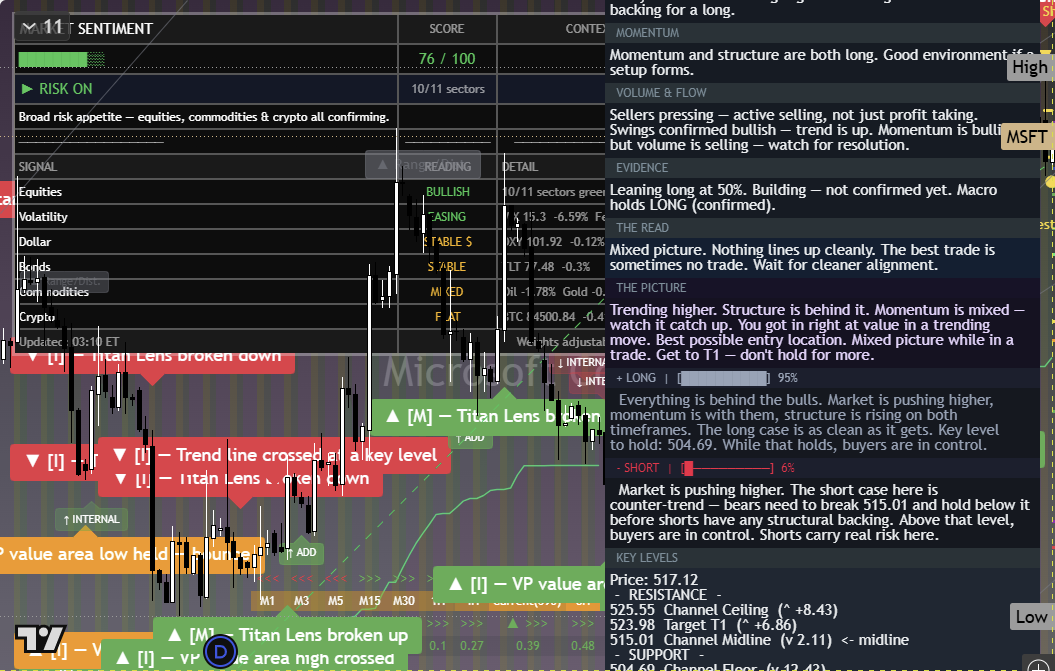
The chart above is the full daily read: structure, momentum, the levels that matter, and where the current price sits against them. Read it top to bottom for the complete picture, and pair it with our session briefs for the wider market context.
This is analysis, not financial advice. It reflects our multi-factor framework and is not a recommendation to buy or sell. Always do your own research and manage your risk.