Microsoft (MSFT) – Daily Read
17 September 2026 | Stock | Titan Macro Desk
$490.30
Microsoft is in a controlled pullback, not yet a broken uptrend. The last price is $490.30, 1.4 percent lower on the day, with the stock trading in the lower half of its one-month range. Momentum is roughly 3.3 percent down over the last two weeks, confirming that sellers currently have the initiative. The important distinction is that near-term pressure has weakened the structure without overturning the longer trend. That matters because this remains a test of whether investors will defend Microsoft’s premium growth profile or demand a deeper reset before rebuilding exposure.
The macro backdrop leaves large technology stocks sensitive to changes in growth expectations, rate expectations, and appetite for long-duration earnings. For Microsoft specifically, the debate remains tied to cloud demand, artificial intelligence spending, the pace at which investment converts into revenue, and whether margins can absorb heavy infrastructure requirements. The one month average is $495.04; price is below it, and the structure reads as a pullback, slipping under the one-month average while the longer trend still points up. That positioning makes Microsoft vulnerable to broader equity weakness, but it also means stabilisation could attract investors who still view the company as a durable compounder rather than a short-cycle trade.
The nearer round number handles at $500.00 and $490.00 define the immediate contest. Reclaiming $500.00 would show that buyers can absorb supply and would begin repairing the short-term tone. Holding $490.00 keeps the current decline orderly, while sustained trade beneath it would suggest that sellers are gaining control. The one month average at $495.04 sits between those handles, so recovering it would provide an early sign that the pullback is maturing. The month swing high is $517.78, about 5.6 percent above the current price, and remains the key ceiling because it marks where the latest advance exhausted demand. Below, a shelf of support at $477.15, about 2.7 percent below, is the main defence against a larger unwind. The three month range is $355.43 to $517.78, illustrating both the strength of the broader advance and the downside air pocket that could emerge if support fails.
The bull path is straightforward: if Microsoft holds $490.00, regains $495.04, and then establishes acceptance above $500.00, buyers should have a credible platform for another test of $517.78. If that test produces a decisive move above $517.78, it opens the path toward $527.78 as supply from the prior peak is cleared. The bear path begins if $490.00 cannot be defended. If selling then drives the stock through $477.15, the pullback becomes structural damage rather than routine consolidation, and losing $477.15 exposes $355.43.
The principal risk to the bullish interpretation is that weakening growth confidence or concern over investment returns causes investors to compress the valuation of the entire asset class. A clean loss of $477.15 invalidates the controlled-pullback view. Conversely, the bearish case is invalidated by firm recovery through $500.00 followed by a decisive break of $517.78. Net, Microsoft remains longer-term constructive but tactically fragile, with buyers needing to recover nearby resistance before the desk should treat the retreat as complete.
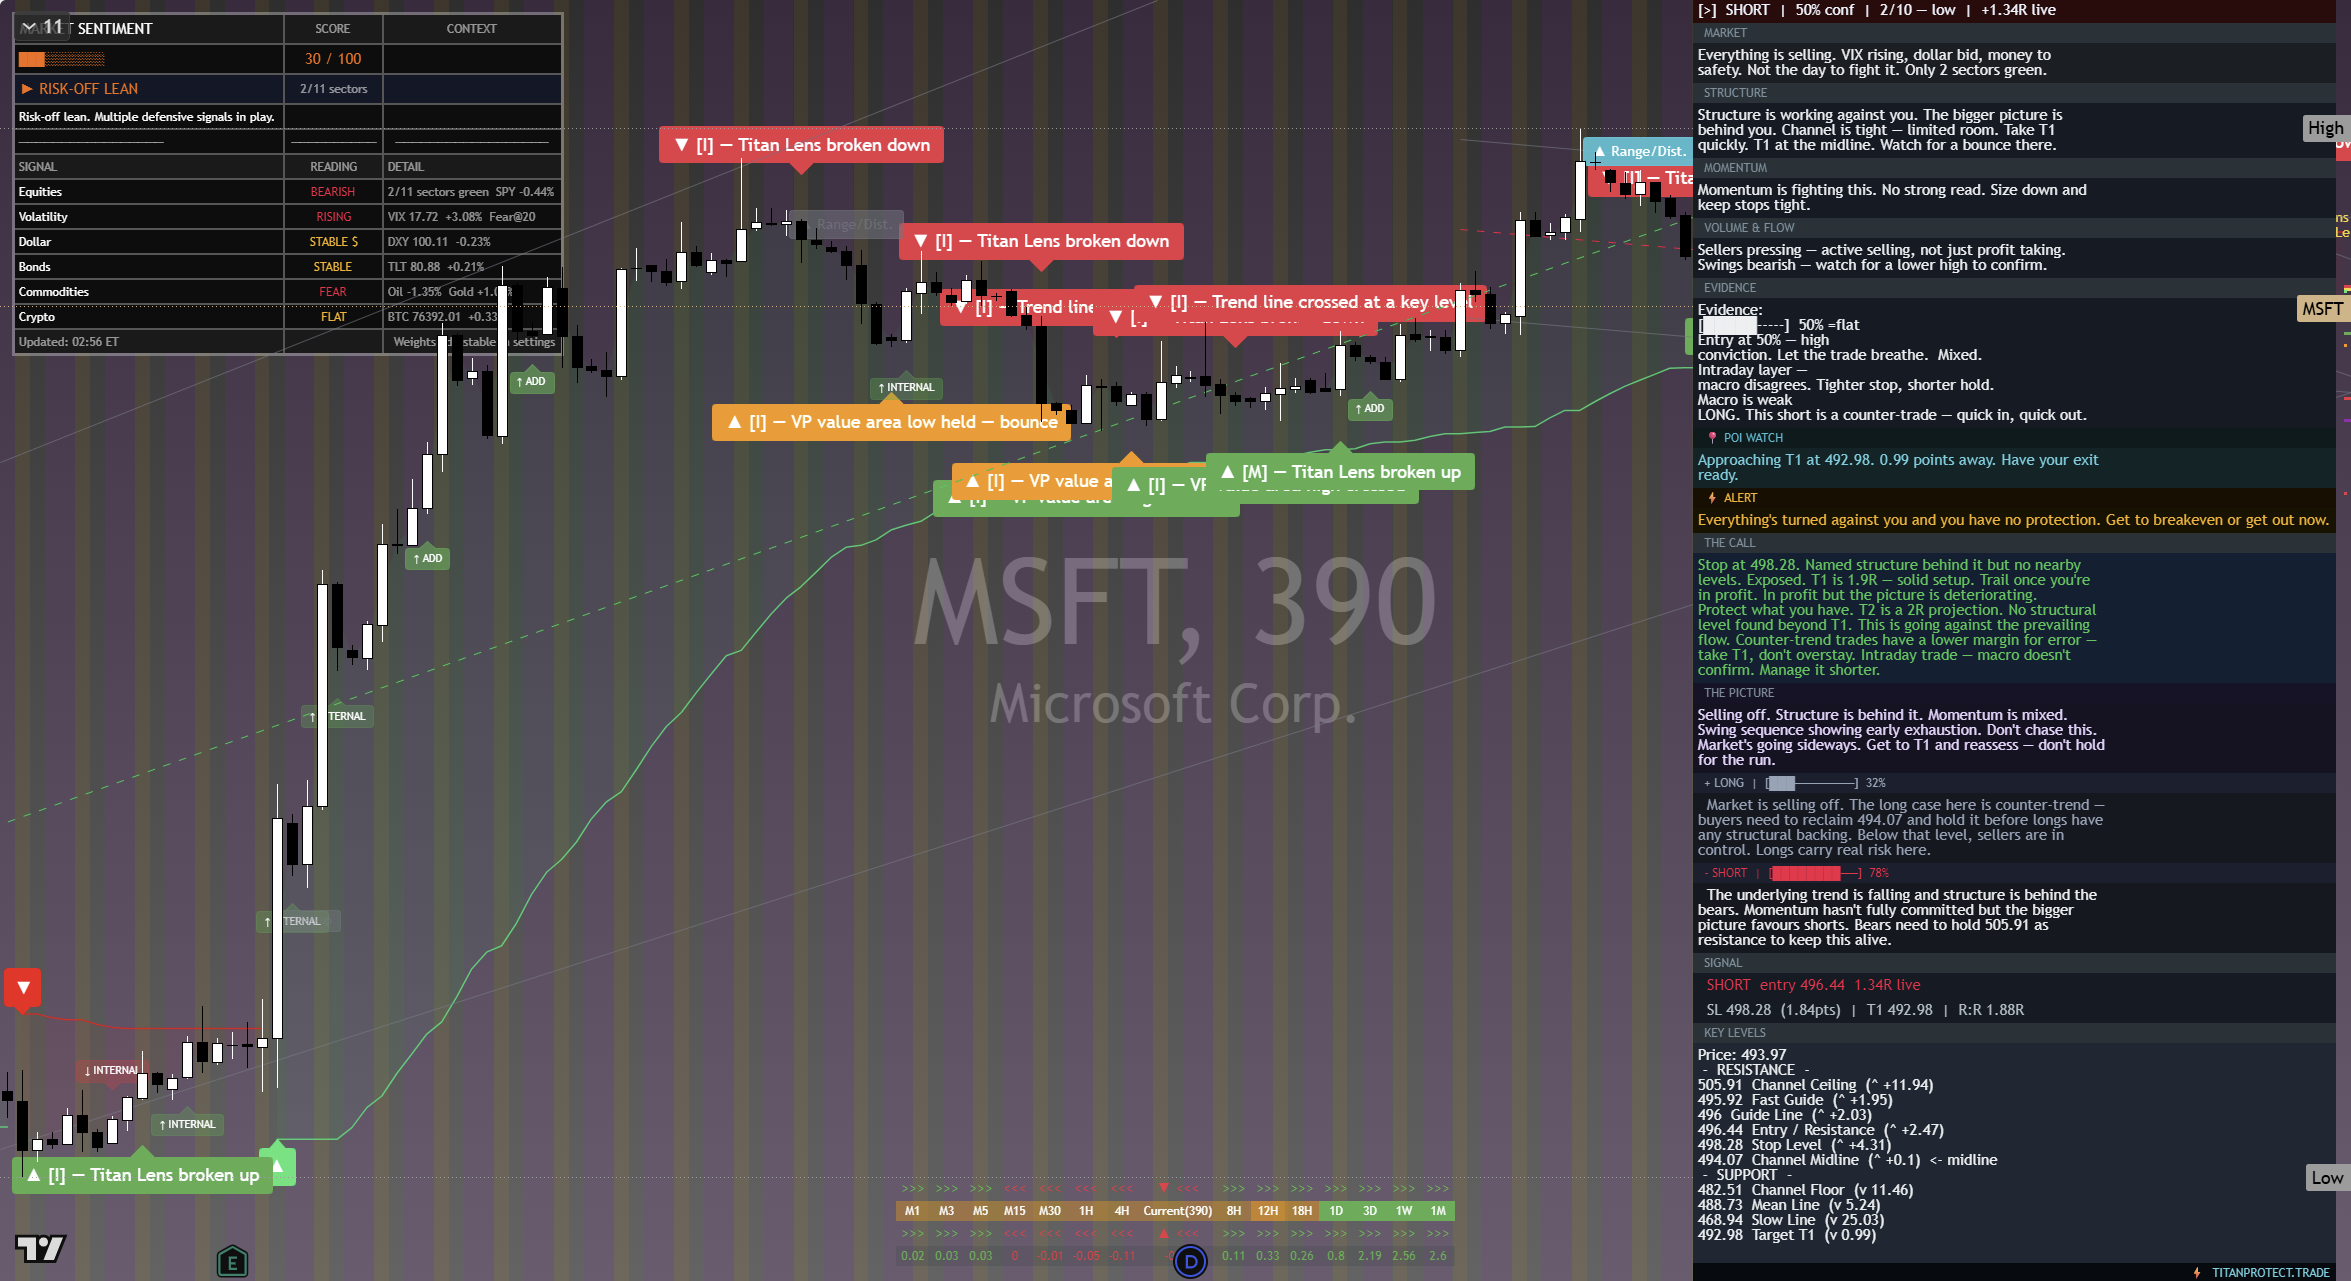
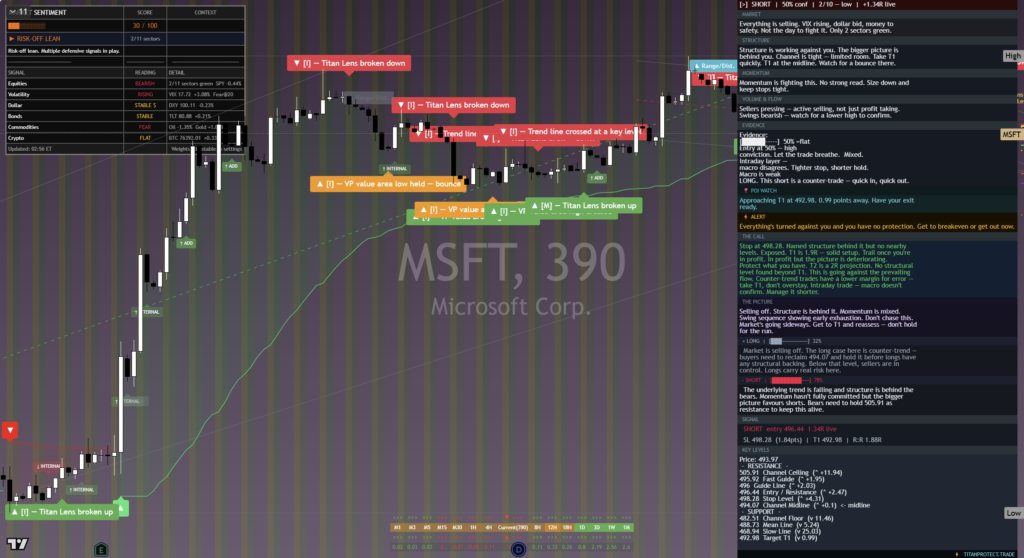
The chart above is the full daily read: structure, momentum, the levels that matter, and where the current price sits against them. Read it top to bottom for the complete picture, and pair it with our session briefs for the wider market context.
This is analysis, not financial advice. It reflects our multi-factor framework and is not a recommendation to buy or sell. Always do your own research and manage your risk.