Microsoft (MSFT) – Daily Read
16 September 2026 | Stock | Titan Macro Desk
$497.12
Microsoft is consolidating within a broader advance, with the last price at $497.12, 0.3 percent higher on the day. The key tension is between a constructive underlying structure and fading near-term momentum. It is sitting mid-range over the past month, so neither side has control at the current price. The view remains cautiously bullish while support holds, but buyers need to reclaim nearby resistance before the stock can resume leadership with conviction.
The wider market backdrop matters because large technology stocks remain sensitive to shifts in growth expectations, financing conditions, and confidence in corporate technology spending. Microsoft also carries company-specific exposure to cloud demand, artificial intelligence investment, and the market’s willingness to reward heavy capital expenditure before all of the revenue benefits are visible. That makes this more than a simple momentum trade. The one month average is $494.54; price is above it, and the structure reads as a clean uptrend, price above both its one-month and longer averages. However, momentum is roughly 3.2 percent down over the last two weeks. That divergence suggests orderly digestion rather than confirmed deterioration, but it also warns that the trend is currently being carried more by established positioning than fresh acceleration.
The nearest decision point is the round number handle at $500.00. Holding above it would improve sentiment because it would show buyers are prepared to accept higher prices rather than merely defend weakness. The other nearby handle at $490.00 matters as the first test of whether pullbacks remain shallow. Below there, the one month average becomes more vulnerable, raising the risk that consolidation turns into a deeper reset. The month swing high is $517.78, about 4.2 percent above the current price. That is the ceiling sellers have already defended and the clearest confirmation level for renewed upside.
The more important downside shelf sits at $477.15, about 4.0 percent below. Buyers need to defend it because it separates a routine pullback from a meaningful failure of the current structure. The three month range of $355.43 to $517.78 shows how far the stock has travelled and why reactions near the upper boundary can be sharp. It also means downside can expand materially if support fails and recent buyers begin unwinding together.
The bull path is straightforward: if Microsoft establishes acceptance above $500.00, holds pullbacks above $490.00 and then produces a decisive move above $517.78, the prior ceiling becomes a launch point and opens the path toward $527.78. The bear path begins if rallies repeatedly fail around the upper handle and price slips beneath the one month average. If that weakness then breaks $477.15, the market loses its key shelf and exposes $355.43, with the breadth of the prior range amplifying the warning.
The main risk to the bullish read is that soft near-term momentum is an early distribution signal rather than consolidation. A sustained loss of $477.15 would invalidate the constructive setup. Conversely, rapid recovery through the month high would weaken the bearish case. Net, the trend deserves respect, but confirmation belongs above resistance and discipline belongs below support.
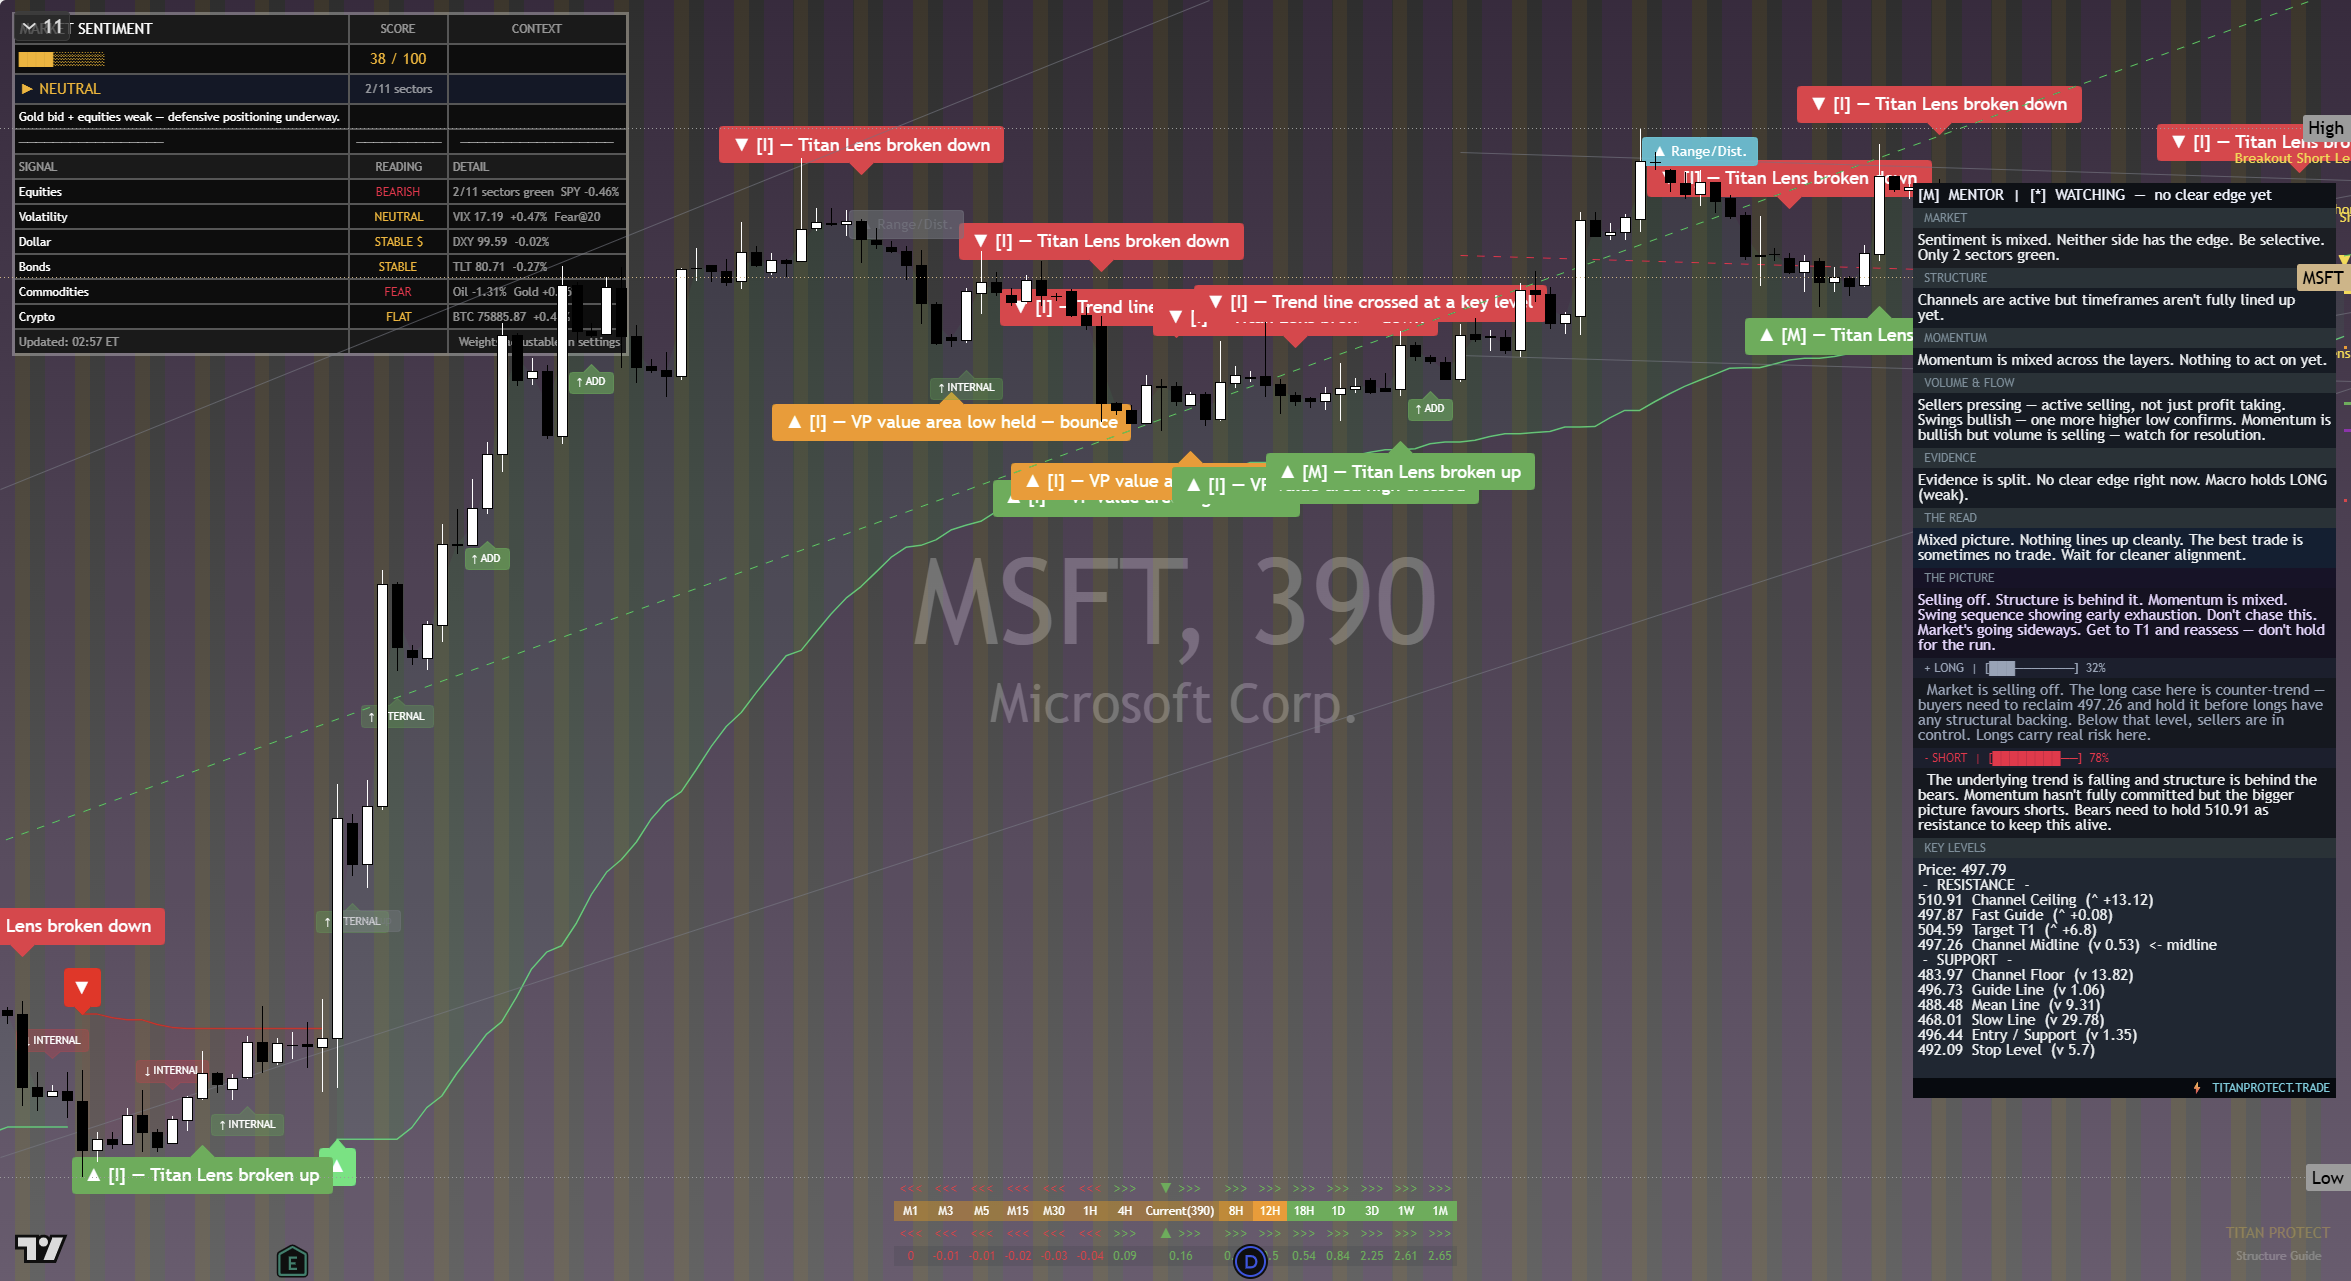
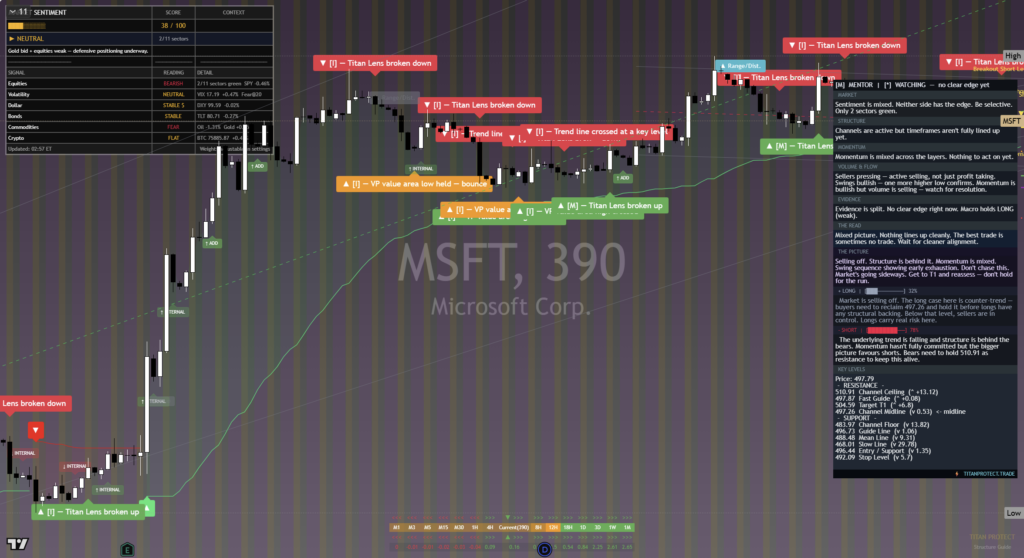
The chart above is the full daily read: structure, momentum, the levels that matter, and where the current price sits against them. Read it top to bottom for the complete picture, and pair it with our session briefs for the wider market context.
This is analysis, not financial advice. It reflects our multi-factor framework and is not a recommendation to buy or sell. Always do your own research and manage your risk.