Microsoft (MSFT) – Daily Read
14 September 2026 | Stock | Titan Macro Desk
$495.63
Microsoft is grinding higher, but the more important message is that trend strength and short-term momentum are currently pulling in opposite directions. The last price is $495.63, 0.6 percent higher on the day, with the shares sitting mid-range over the past month. The broader structure remains constructive, yet the recent loss of momentum argues against treating every uptick as an immediate breakout. The clear view is cautiously bullish while price holds its underlying support, with confirmation still required above the recent peak.
The macro backdrop matters because large technology stocks remain sensitive to changing expectations for growth, interest rates, and corporate investment. Microsoft also carries its own powerful drivers through cloud demand, artificial intelligence spending, and the market’s judgment on whether heavy investment can translate into durable earnings growth. That combination can sustain a premium when confidence is firm, but it can also magnify disappointment when investors question execution or returns on capital. Momentum roughly 1.9 percent down over the last two weeks shows that buyers have recently become less aggressive, even though the primary structure has not broken.
The one month average is $494.45; price is above it, and the structure reads as a clean uptrend, price above both its one-month and longer averages. That makes the immediate area a useful test of whether buyers still control pullbacks. The nearer round number handles at $500.00 and $490.00 frame the current contest. Holding above $500.00 would suggest demand is becoming comfortable at higher prices, while slipping beneath $490.00 would place greater pressure on the trend and invite a deeper test.
The month swing high is $517.78, about 4.5 percent above the current price. That level represents the point where previous buying failed to extend, so it is the main barrier separating consolidation from renewed price discovery. A shelf of support at $477.15, about 3.7 percent below, is defended by prior demand and by investors seeking exposure to the broader uptrend at a better entry point. The three month range is $355.43 to $517.78, which underlines how consequential the outer boundaries are compared with the tighter battle around current prices.
The bull path is straightforward: if Microsoft reclaims $500.00, holds it through follow-through buying, and then delivers a decisive move above $517.78, that opens the path toward $527.78. Such a sequence would confirm that recent weakness was consolidation within an intact advance. The bear path begins if $490.00 fails and rebounds cannot recover it. If selling then overwhelms $477.15, losing $477.15 exposes $355.43, because the market would have broken the shelf supporting the current trend and reopened the wider range.
The principal risk to the bullish read is that fading short-term momentum becomes persistent distribution rather than a pause. A failure at $500.00 followed by acceptance below $490.00 would weaken confidence, while a sustained loss of $477.15 would invalidate the constructive structure. Conversely, strength through the high would invalidate the bearish path. Net, Microsoft remains an uptrend in consolidation, with buyers retaining the advantage but needing a breakout to turn that advantage into a fresh leg higher.
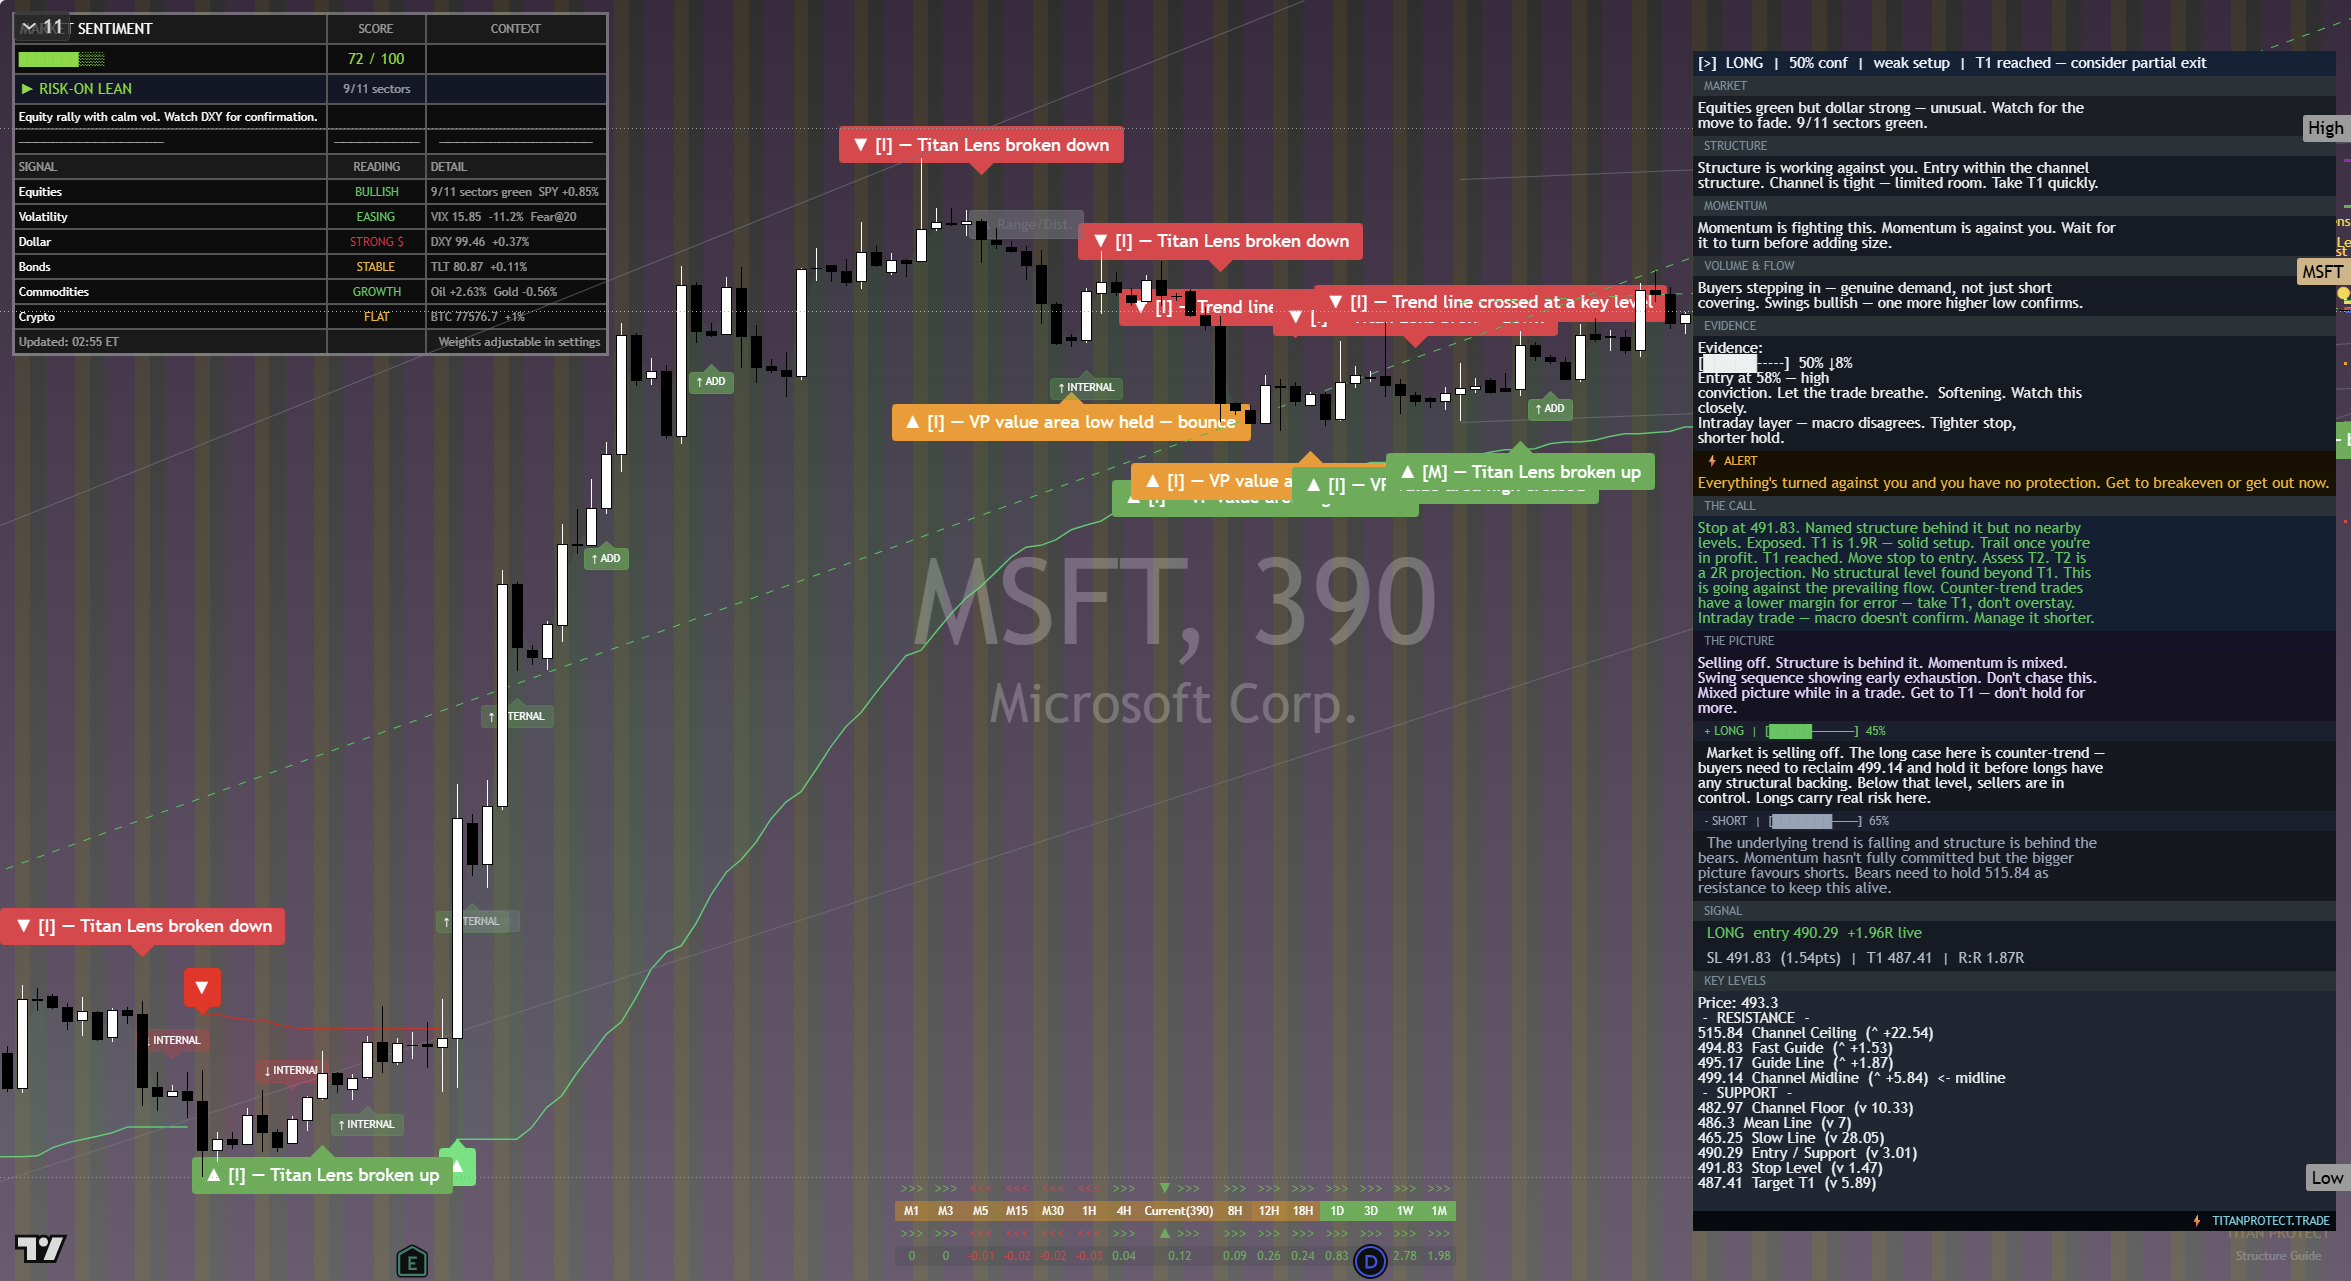
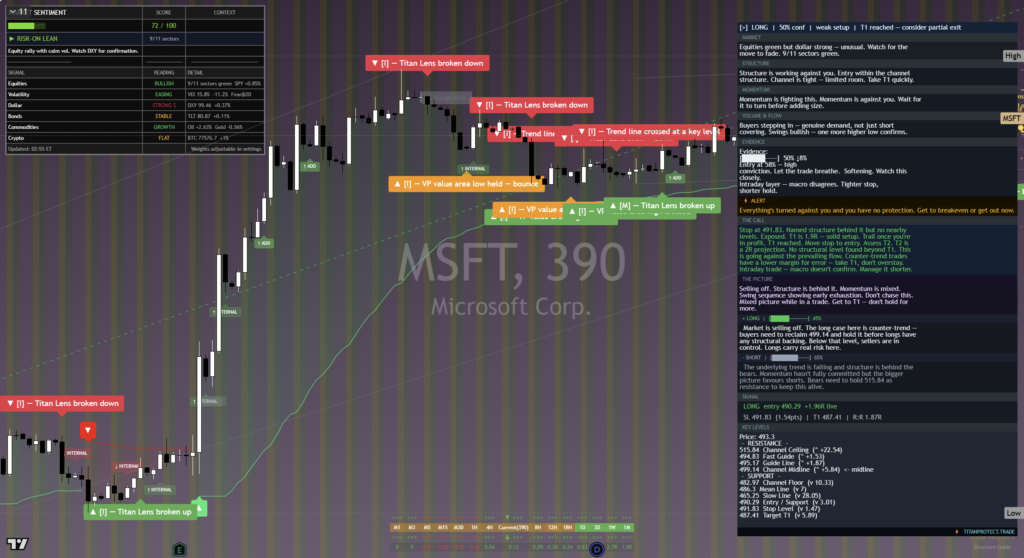
The chart above is the full daily read: structure, momentum, the levels that matter, and where the current price sits against them. Read it top to bottom for the complete picture, and pair it with our session briefs for the wider market context.
This is analysis, not financial advice. It reflects our multi-factor framework and is not a recommendation to buy or sell. Always do your own research and manage your risk.