Microsoft (MSFT) – Daily Read
11 September 2026 | Stock | Titan Macro Desk
$492.44
Microsoft is consolidating within a longer-term advance, but the near-term tape lacks enough force to confirm that the pullback has run its course. The last price is $492.44, 0.2 percent higher on the day, yet it is trading in the lower half of its one-month range. That combination matters because a modest positive session does not by itself repair the softer recent structure. The constructive view remains intact, but buyers need to reclaim nearby resistance before the balance of evidence shifts decisively back toward upside continuation.
The macro backdrop is chiefly about the market’s assessment of growth, interest rates, and the durability of corporate technology spending. Microsoft sits at the intersection of those themes. Its scale and recurring business mix can attract capital when investors favor quality, while its cloud and artificial intelligence exposure makes the stock sensitive to expectations for investment, adoption, and eventual monetization. The one month average is $494.52; price is below it, and the structure reads as a pullback, slipping under the one-month average while the longer trend still points up. Price action is roughly 0.8 percent down over the last two weeks, showing controlled erosion rather than decisive liquidation.
The nearer round number handles at $500.00 and $490.00 define the immediate contest. Holding $490.00 would suggest that buyers are willing to defend weakness before the pullback deepens, while reclaiming $500.00 would improve control and put the market back above a psychologically important threshold. The month swing high is $517.78, about 5.1 percent above the current price. That is the key upside boundary because supply previously halted the advance there. A decisive move above $517.78 opens the path toward $527.78, signaling that the market has absorbed that supply and resumed price discovery. Below, a shelf of support at $477.15, about 3.1 percent below, is the more important defensive line. It represents the area where buyers must prevent a routine pullback from becoming structural damage. The three month range is $355.43 to $517.78, which shows both the strength of the broader advance and the potential air pocket if support fails.
The bull path is straightforward: if Microsoft holds $490.00, recovers the one month average at $494.52, and establishes acceptance above $500.00, then pressure should build toward $517.78. If buyers then deliver a decisive break, $527.78 becomes the next destination. The bear path begins if rebounds repeatedly fail below $500.00 and sellers force price through $490.00. If that weakness extends and losing $477.15 exposes $355.43, the market would be signaling that the pullback has developed into a much broader reassessment.
The principal risk to the bullish read is a deterioration in growth expectations, technology spending confidence, or enthusiasm around artificial intelligence returns. Conversely, sustained trade above $517.78 would invalidate the cautious near-term stance. Net, Microsoft remains longer-term constructive but tactically unresolved, with $490.00 defending the immediate setup and $500.00 separating stabilization from renewed upside control.
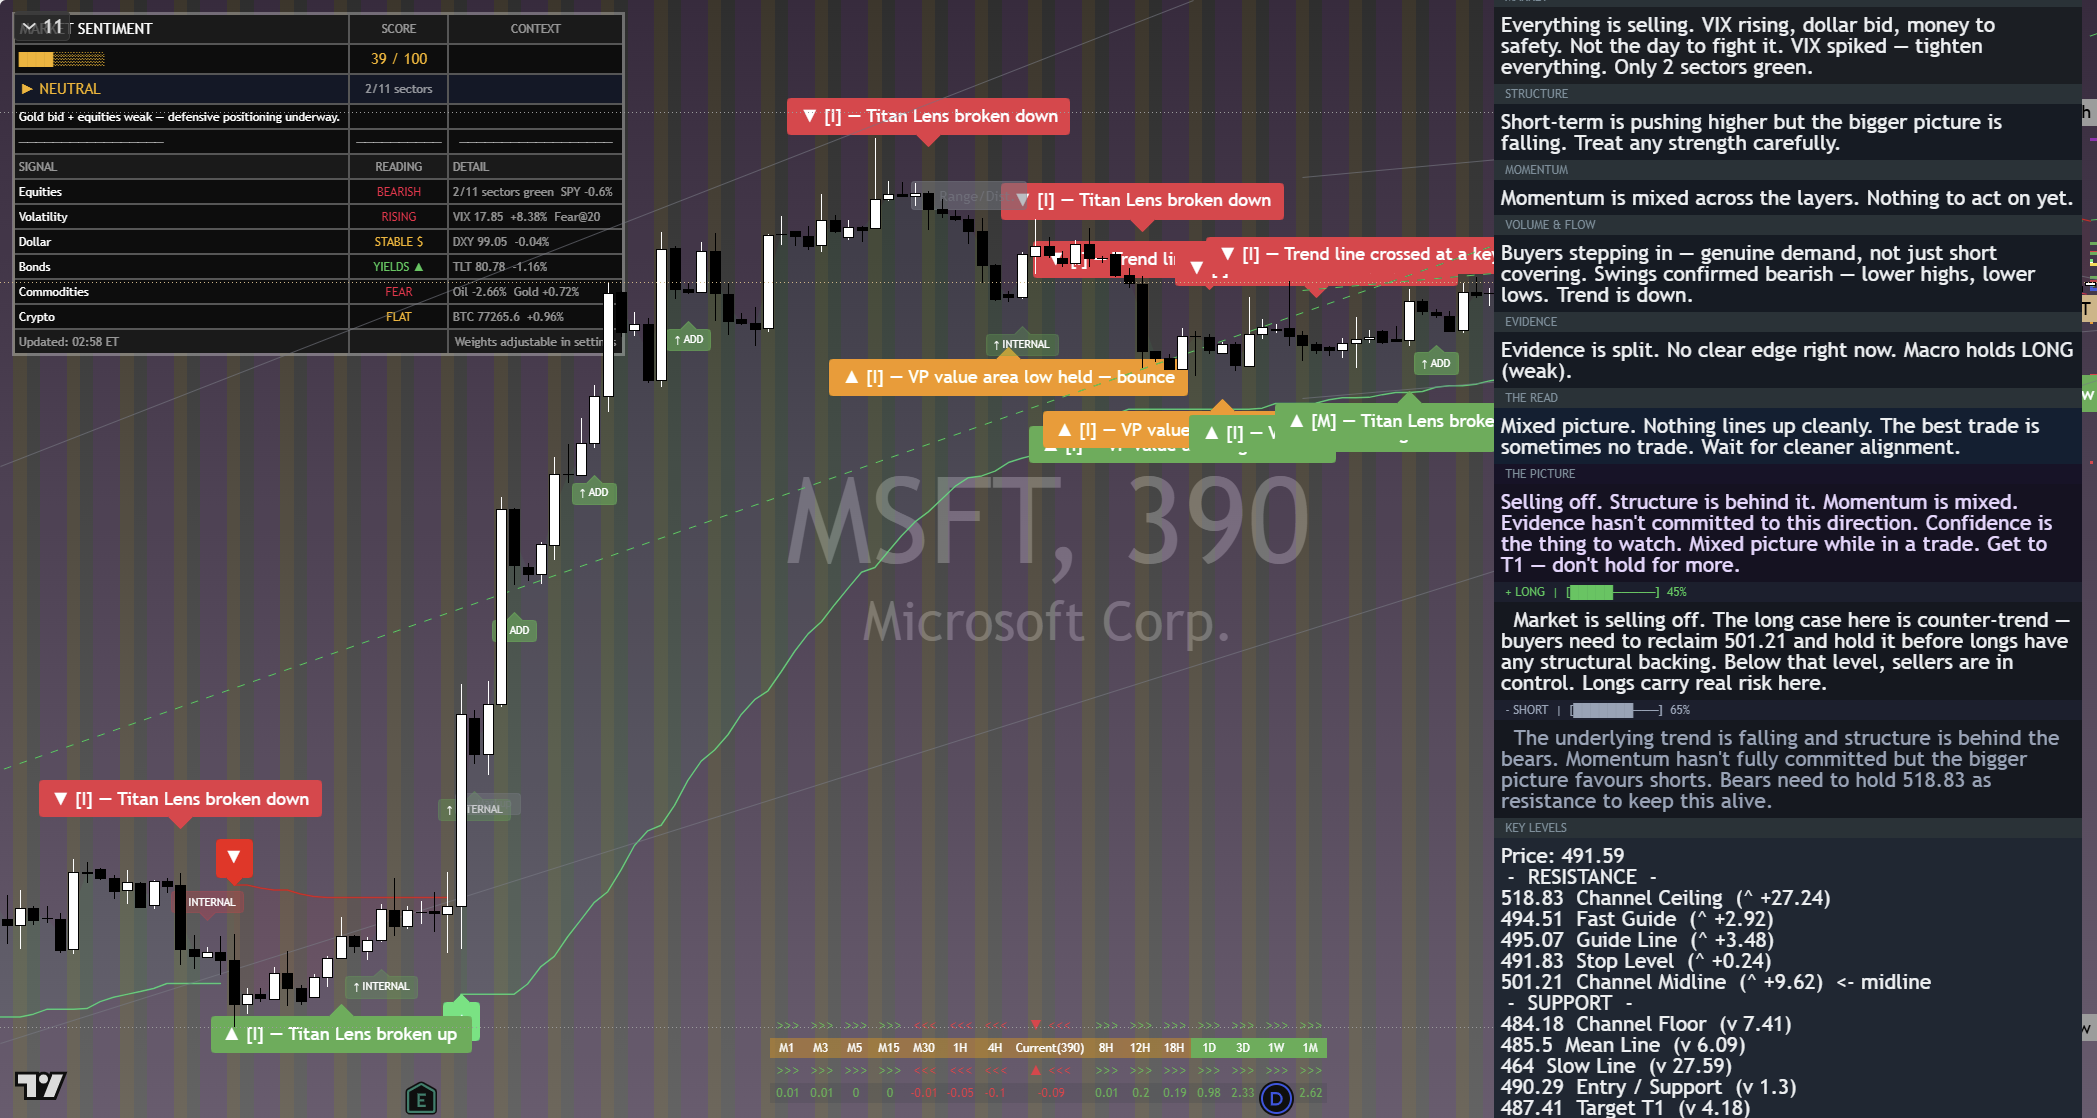
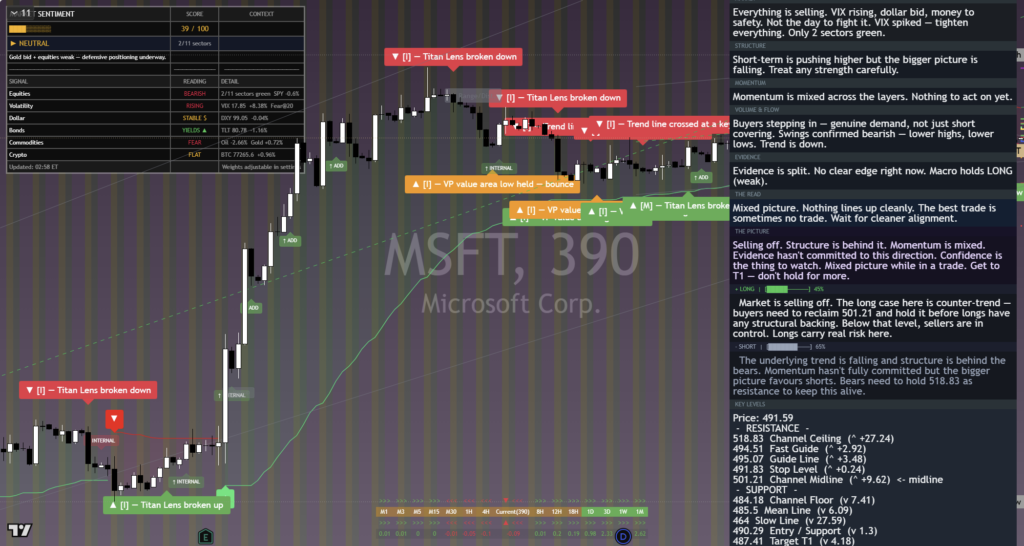
The chart above is the full daily read: structure, momentum, the levels that matter, and where the current price sits against them. Read it top to bottom for the complete picture, and pair it with our session briefs for the wider market context.
This is analysis, not financial advice. It reflects our multi-factor framework and is not a recommendation to buy or sell. Always do your own research and manage your risk.