Microsoft (MSFT) – Daily Read
9 September 2026 | Stock | Titan Macro Desk
$493.95
Microsoft is in a constructive longer-term trend, but the immediate tape is testing whether buyers still have enough conviction to absorb a routine pullback. The last price is $493.95, 1.2 percent lower on the day, leaving the stock below its one month average and caught between nearby psychological handles. The clear view is cautiously bullish while support holds: this looks more like consolidation within an advancing structure than a confirmed reversal, but the stock now needs to reclaim lost ground before upside momentum can become persuasive again.
The broader macro backdrop matters because large-cap technology remains sensitive to shifts in growth expectations, interest-rate assumptions, and appetite for long-duration earnings. Microsoft also carries instrument-specific support from the market’s focus on cloud demand, artificial intelligence spending, and the returns generated from heavy infrastructure investment. Against that backdrop, it is sitting mid-range over the past month. The one month average is $495.12; price is below it, and the structure reads as a pullback, slipping under the one-month average while the longer trend still points up. Momentum roughly 1.4 percent up over the last two weeks reinforces that tension: underlying demand has not disappeared, yet buyers have not maintained control of the immediate session.
The nearest decision area is formed by the round number handles at $500.00 and $490.00. Reclaiming $500.00 would show that buyers can reverse the latest weakness and re-establish control above the one month average. Holding $490.00 would keep the pullback orderly, while sustained trade below it would suggest that sellers are gaining traction. The month swing high is $517.78, about 4.8 percent above the current price, and it represents the ceiling that has capped recent progress. A decisive move above $517.78 opens the path toward $527.78 because it would remove the visible supply at the range high and confirm renewed expansion.
Below, a shelf of support sits at $477.15, about 3.4 percent below. That area matters because buyers defending it would preserve the sequence of higher structural levels and keep weakness contained. Losing $477.15 exposes $355.43, turning a modest retracement into a materially more defensive setup. The full three month range is $355.43 to $517.78, which shows both how far the advance has travelled and how much downside air could emerge if the established floor fails.
The bull path is straightforward: if Microsoft holds $490.00, recovers $495.12, and establishes acceptance above $500.00, then pressure can rebuild toward $517.78. If that ceiling breaks decisively, then $527.78 becomes the next objective. The bear path begins if recovery attempts fail beneath $495.12 and $500.00. If sellers then force a break through $490.00, the market is likely to test $477.15; if that shelf gives way, then $355.43 becomes exposed.
The principal risk to the constructive read is that macro sensitivity overwhelms company-specific confidence and converts profit-taking into sustained de-risking. Failure at $500.00 alone would delay the bull case, but losing $477.15 would invalidate the pullback interpretation. Net, Microsoft remains structurally constructive but tactically unsettled, with buyers needing a reclaim of nearby resistance to regain authority.
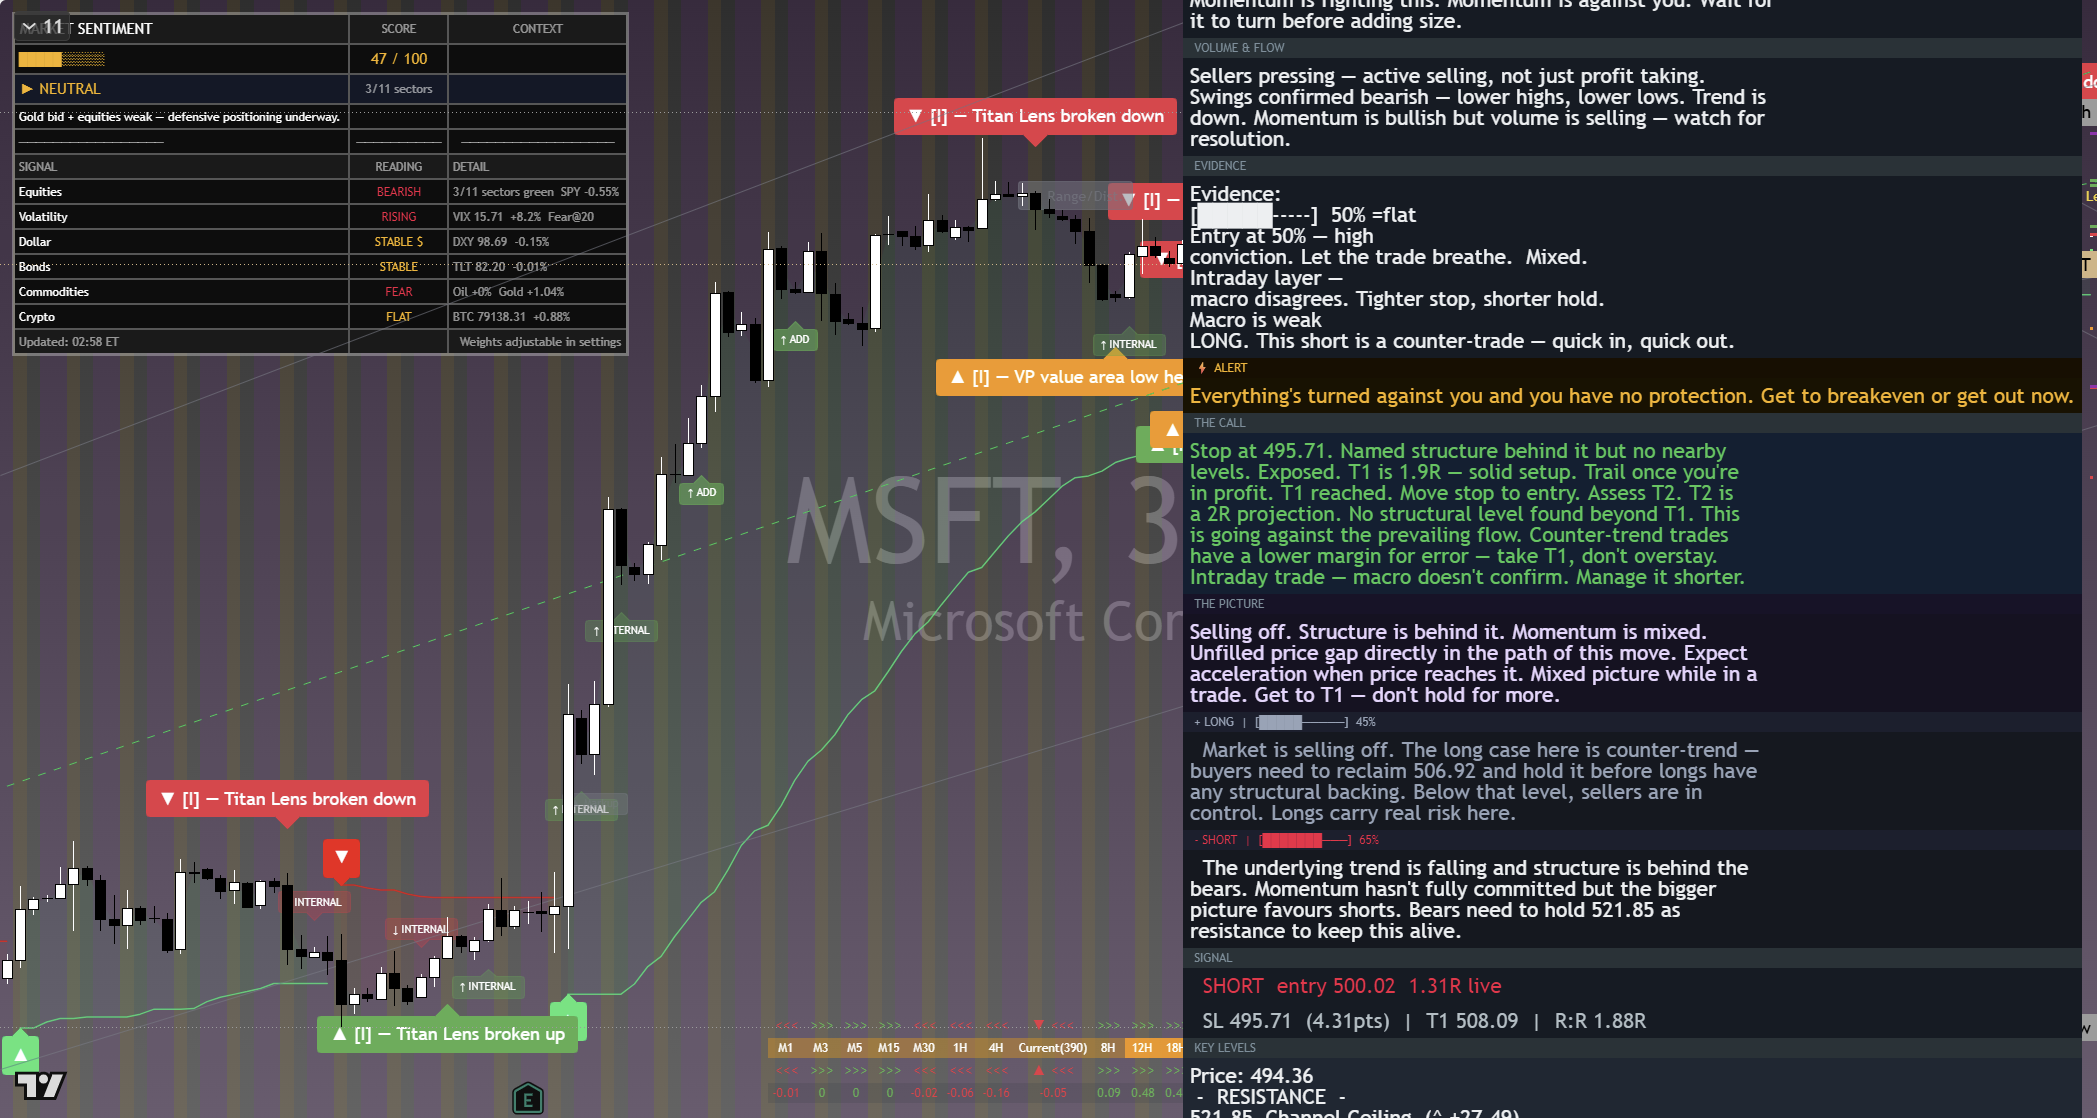
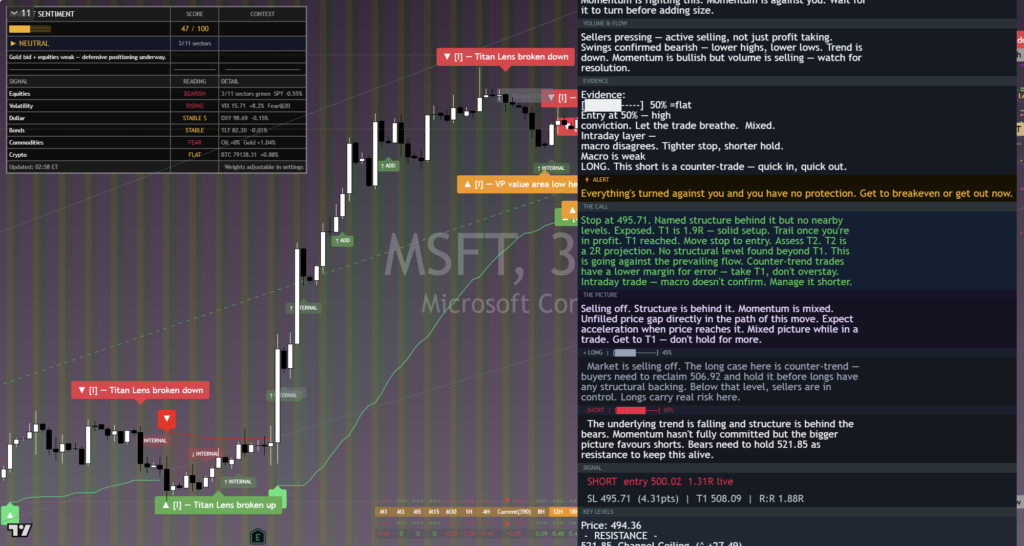
The chart above is the full daily read: structure, momentum, the levels that matter, and where the current price sits against them. Read it top to bottom for the complete picture, and pair it with our session briefs for the wider market context.
This is analysis, not financial advice. It reflects our multi-factor framework and is not a recommendation to buy or sell. Always do your own research and manage your risk.