Microsoft (MSFT) – Daily Read
8 September 2026 | Stock | Titan Macro Desk
$499.70
Microsoft is absorbing a sharp daily setback without yet breaking its broader advance. Last price is $499.70, 2.0 percent lower on the day, but the stock remains above its underlying trend references and is sitting mid-range over the past month. The clear view is constructive while support holds: this looks more like pressure inside an established uptrend than a confirmed reversal. That distinction matters because continued resilience could attract buyers back toward the recent peak, while failure at support would transform an orderly pullback into a much larger downside reset.
The wider equity backdrop is defined by sensitivity to growth expectations, interest-rate assumptions, and the durability of corporate technology spending. Microsoft carries particular weight in that debate because its valuation depends on confidence in sustained cloud demand, enterprise software resilience, and the commercial payoff from artificial intelligence investment. Today’s decline therefore tests whether investors still treat weakness as an opportunity to rebuild exposure or are beginning to demand a larger valuation cushion. Momentum is roughly 3.4 percent up over the last two weeks, so some short-term profit-taking is understandable, but it has not erased the broader positive structure.
The one month average is $495.73; price is above it, and the structure reads as a clean uptrend, price above both its one-month and longer averages. That makes the nearby $500.00 handle an immediate sentiment pivot. Holding around it would suggest buyers remain comfortable defending the trend, while persistent trade below it would shift attention to $490.00. That lower round number is the nearer line between routine consolidation and a deeper test of demand. Recovery above $500.00 would improve the tone, but the month swing high at $517.78, about 3.6 percent above the current price, is the real ceiling. Sellers who defended the recent peak are likely to matter there again.
Below, a shelf of support at $477.15, about 4.5 percent below, is the key structural defense. It offers enough distance from current trade to absorb ordinary volatility, but losing it would show that buyers are no longer defending the prior base. The three month range is $355.43 to $517.78, highlighting both the scale of the advance and the air pocket that could emerge if the shelf fails.
If Microsoft stabilizes around $500.00, holds $495.73, and reclaims momentum toward $517.78, then a decisive move above $517.78 opens the path toward $527.78. That bull path would confirm that the pullback refreshed demand rather than damaged the trend. If price instead remains below $500.00, loses $490.00, and selling accelerates through $477.15, then losing $477.15 exposes $355.43. That bear path would signal a structural failure rather than a shallow retracement.
The main risk to the constructive read is a broad de-rating in growth stocks or weaker confidence in Microsoft’s earnings durability. A sustained loss of $477.15 invalidates the trend-defense thesis; firm acceptance above $517.78 invalidates the near-term caution. Net, the stock remains structurally bullish, but buyers must convert support into a credible rebound before conviction improves.
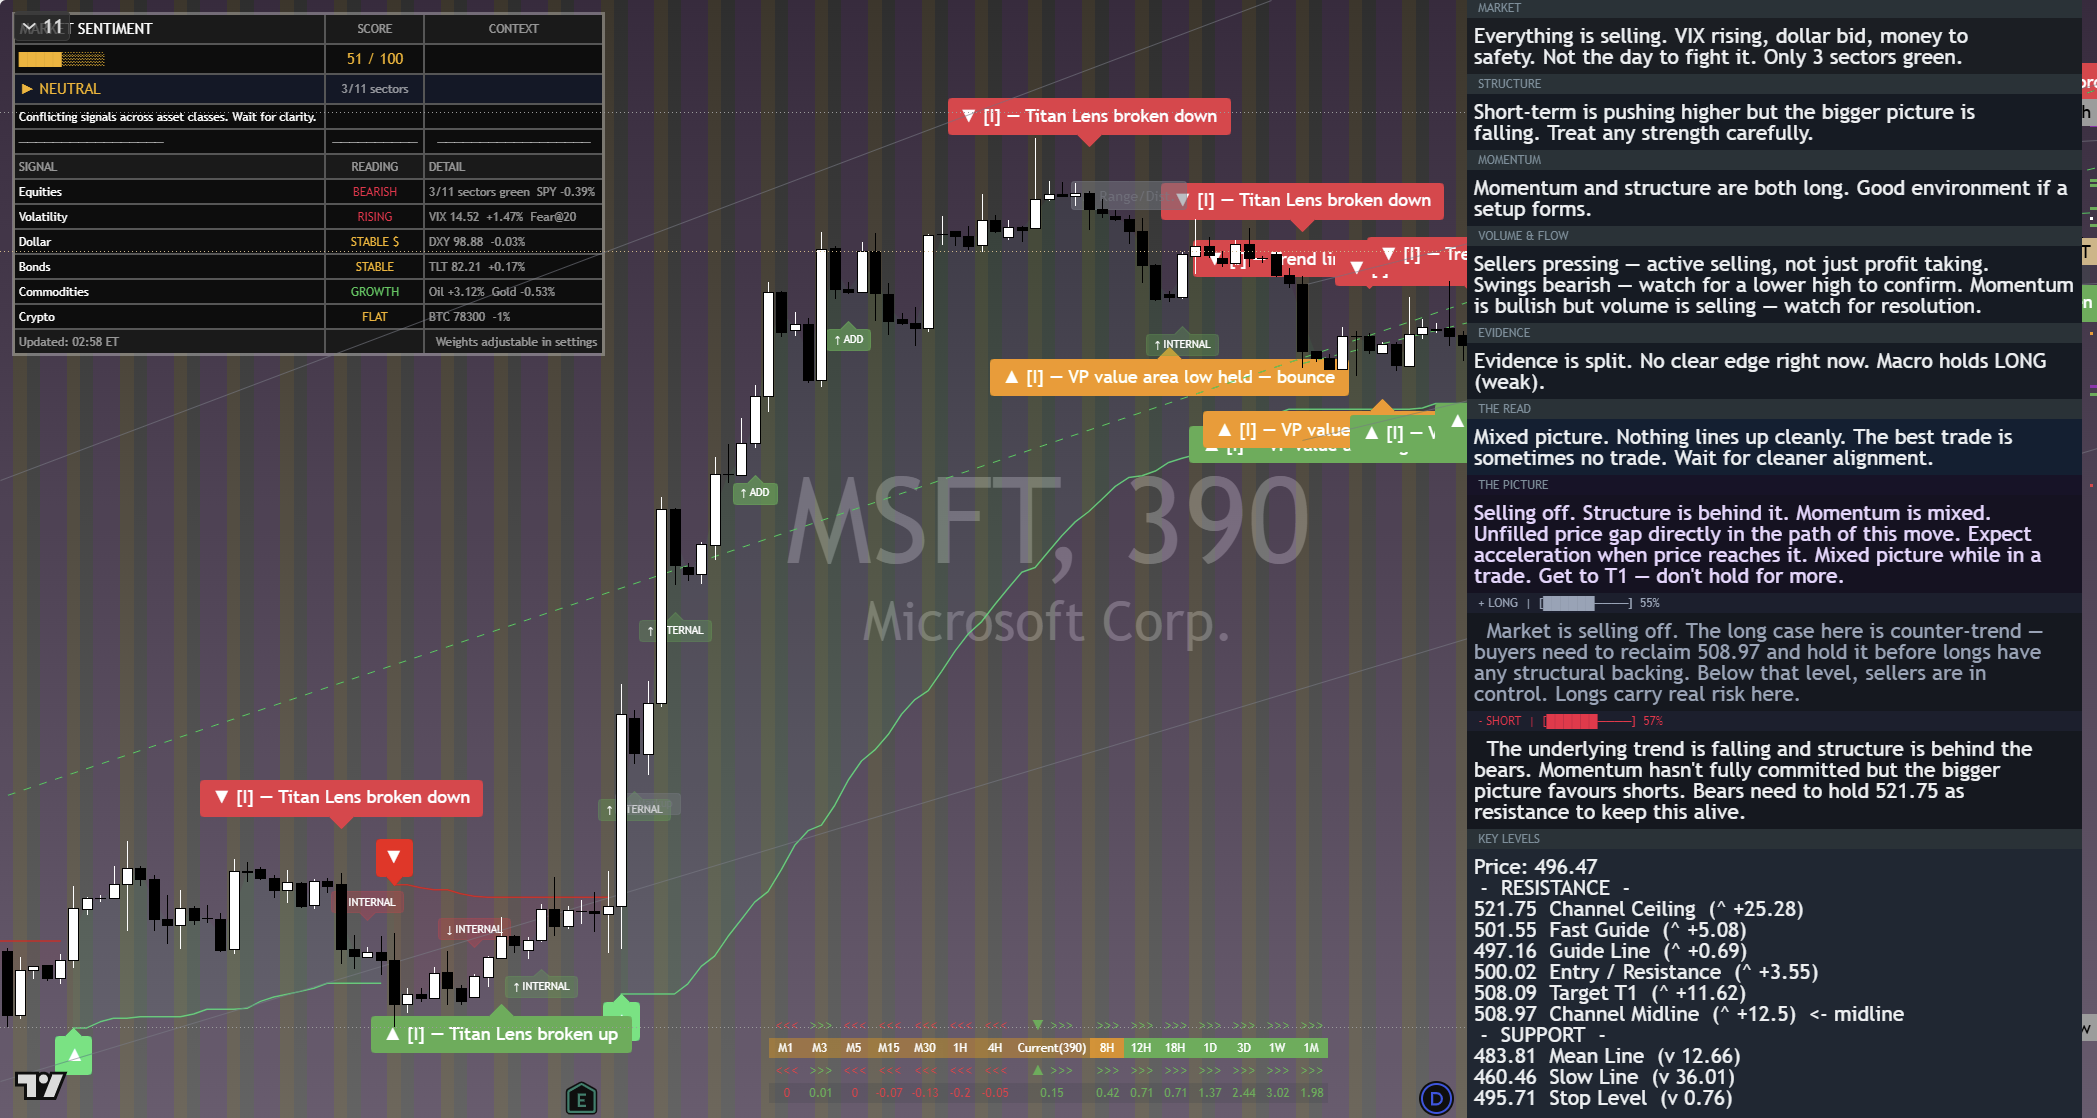
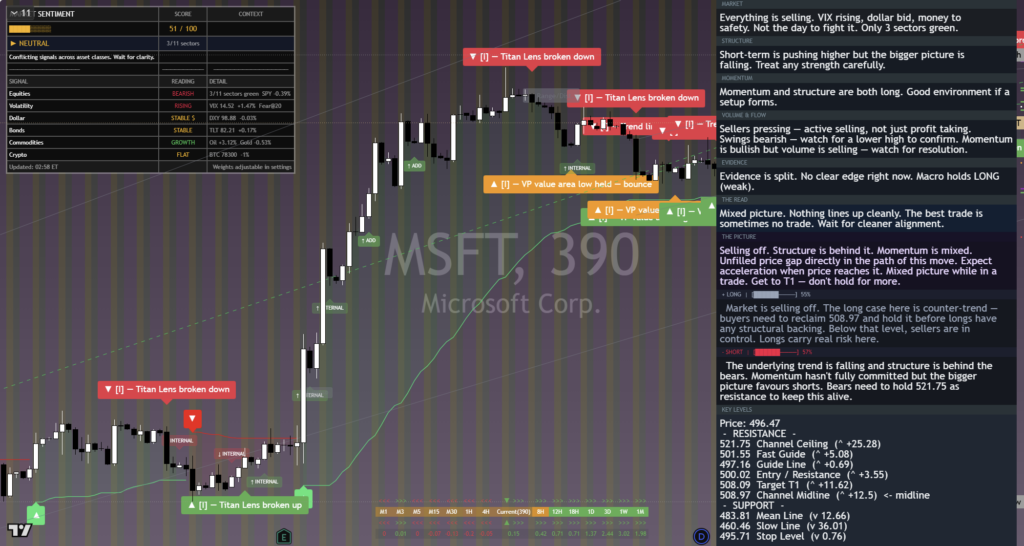
The chart above is the full daily read: structure, momentum, the levels that matter, and where the current price sits against them. Read it top to bottom for the complete picture, and pair it with our session briefs for the wider market context.
This is analysis, not financial advice. It reflects our multi-factor framework and is not a recommendation to buy or sell. Always do your own research and manage your risk.