Meta (META) – Daily Read
4 October 2026 | Stock | Titan Macro Desk
$728.08
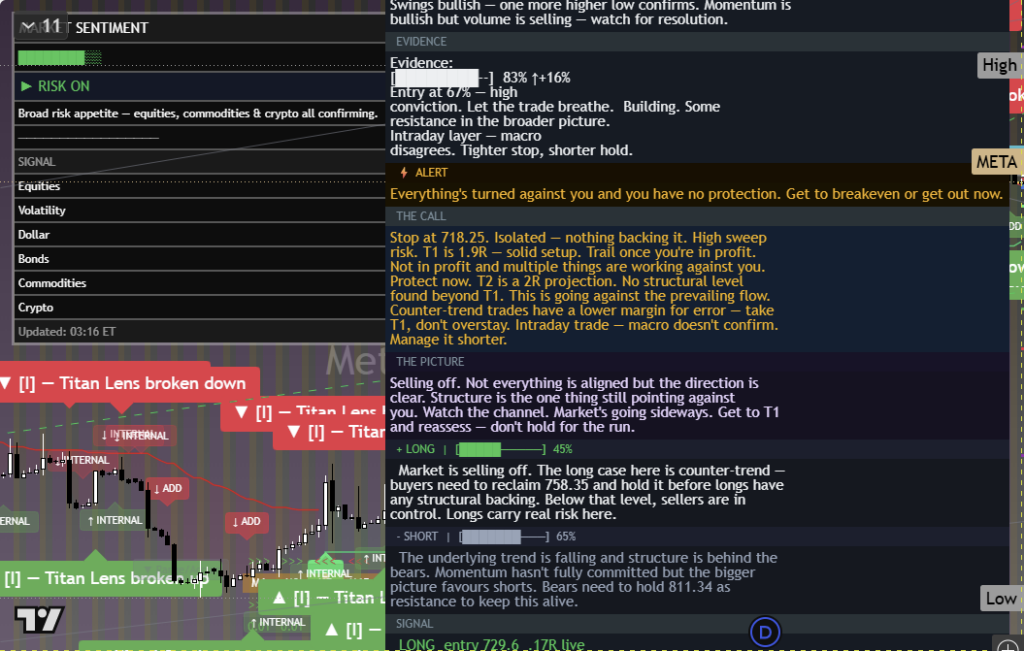
Meta is trading like a leadership stock whose buyers still control the trend, but the immediate test is whether strength can convert into a clean breakout rather than stall near familiar supply. The last price is $728.08, 0.3 percent higher on the day, and it is holding in the upper half of its one-month range. That matters because the market is accepting elevated prices instead of forcing a deeper reset. The clear view is constructive while nearby support holds, although the distance to major downside support makes discipline important if sentiment turns.
The macro backdrop for large technology stocks remains a contest between earnings confidence and sensitivity to changing growth and discount-rate expectations. Meta sits directly in that debate because investors must balance the durability of its advertising engine and the potential payoff from artificial intelligence investment against the cost and execution risk of that spending. The stock’s behavior suggests confidence currently has the advantage. Momentum is roughly 9.4 percent up over the last two weeks, while the one month average is $695.92. Price is above it, and the structure reads as a clean uptrend, with price above both its one-month and longer averages. That combination can keep systematic and discretionary buyers engaged, provided fresh demand appears on tests of support.
The first tactical reference is $725.00. It matters because price is sitting close enough for that round number to act as an immediate test of buyer commitment. Holding it would show that shallow weakness is still being absorbed. The next upside handle is $750.00, where profit-taking and hesitant supply may emerge before the larger breakout test. Above that sits the month swing high at $779.82, about 7.1 percent above the current price. That is the defining ceiling because sellers previously stopped the advance there. A decisive move above $779.82 opens the path toward $804.82 and would signal that the market is willing to reprice Meta beyond the established range.
On the downside, $695.92 is the first meaningful structural reference because a retreat through the recent average would weaken the clean trend and suggest that momentum is fading. The deeper shelf of support at $577.00, about 20.8 percent below, is where longer-horizon demand must defend the broader structure. The three month range is $524.52 to $779.82, so losing $577.00 exposes $524.52 and would turn a routine pullback into a much more damaging range reversal.
The bull path is straightforward: if $725.00 holds and buyers reclaim $750.00 with persistence, then pressure should build against $779.82; if that ceiling breaks decisively, then $804.82 becomes the logical extension. The bear path begins if $725.00 fails and price cannot recover $695.92. In that case, the advance would look increasingly exhausted, and pressure could migrate toward $577.00; if that shelf breaks, then $524.52 comes into view.
The main risk is that broad technology appetite deteriorates while Meta-specific spending concerns challenge earnings confidence. A sustained loss of $695.92 would invalidate the near-term bullish posture, while a loss of $577.00 would invalidate the broader constructive read. Net, Meta remains an uptrend to respect, with $725.00 controlling the immediate tape and $779.82 controlling the next major leg.
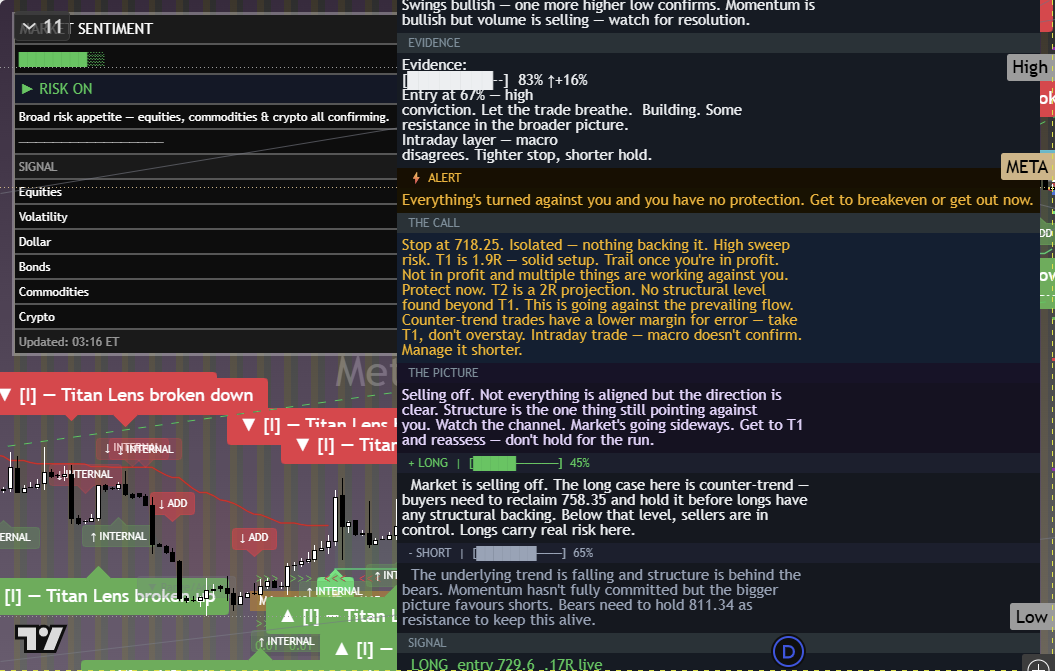
The chart above is the full daily read: structure, momentum, the levels that matter, and where the current price sits against them. Read it top to bottom for the complete picture, and pair it with our session briefs for the wider market context.
This is analysis, not financial advice. It reflects our multi-factor framework and is not a recommendation to buy or sell. Always do your own research and manage your risk.