Meta (META) – Daily Read
16 September 2026 | Stock | Titan Macro Desk
$670.24
Meta is attempting a meaningful recovery, with the last price at $670.24, 3.4 percent higher on the day, and pressing the top of its one-month range. The immediate view is constructive because buyers are accepting higher prices after a forceful rebound, but the stock is entering an area where conviction must replace momentum. This matters because a clean range breakout would shift the discussion from recovery toward renewed expansion, while rejection would show that the recent advance has moved faster than the underlying structure can sustain.
The broader market backdrop is best described as selective rather than uniformly supportive. Investors remain sensitive to growth expectations, financing conditions, and whether large technology companies can translate heavy investment into durable earnings. For Meta specifically, the debate centers on the resilience of its advertising engine, engagement across its platforms, and confidence that spending can produce attractive returns. Momentum roughly 16.0 percent up over the last two weeks shows that expectations have improved quickly. The one month average $590.52 sits well below the market; price is above it, and the structure reads as a recovery attempt, back above the one-month average but still under the longer one. That combination supports the rebound while warning that the larger repair is not yet complete.
The key near-term battleground is the month swing high $678.87, about 1.3 percent above the current price. That level defines the ceiling of both the recent recovery and the three month range $524.52 to $678.87, so sellers defending it are protecting the broader range rather than merely fading a short-term move. The nearer round number handles at $680.00 and $670.00 sharpen the tactical map. Holding $670.00 would indicate that buyers are comfortable maintaining exposure close to resistance. A decisive move above $678.87 opens the path toward $680.00, where sustained acceptance would strengthen the breakout signal. Below, a shelf of support at $537.28, about 19.8 percent below, represents the more important structural defense. Losing $537.28 exposes $524.52 and would turn the recovery into a failed attempt.
The bull path is straightforward: if Meta holds $670.00, absorbs supply at $678.87, and then establishes itself above that barrier, the move toward $680.00 should follow, with the former range ceiling becoming the level buyers need to defend. That sequence would confirm that demand is broad enough to carry the stock beyond a sharp two-week rebound. The bear path begins if repeated tests of $678.87 fail and price cannot retain $670.00. In that case, profit-taking could deepen into a wider retracement. If selling eventually reaches and breaks $537.28, then $524.52 becomes exposed and the bullish structure is invalidated.
The main risk is chasing strength directly beneath established resistance after a rapid advance. A breakout that cannot hold would leave late buyers vulnerable, while a deterioration in the market’s appetite for large technology exposure could amplify the reversal. The read is invalidated decisively by losing $537.28, not by ordinary hesitation near the highs. Net, Meta has a bullish near-term bias, but $678.87 must be cleared and defended before the recovery can be treated as a durable breakout.
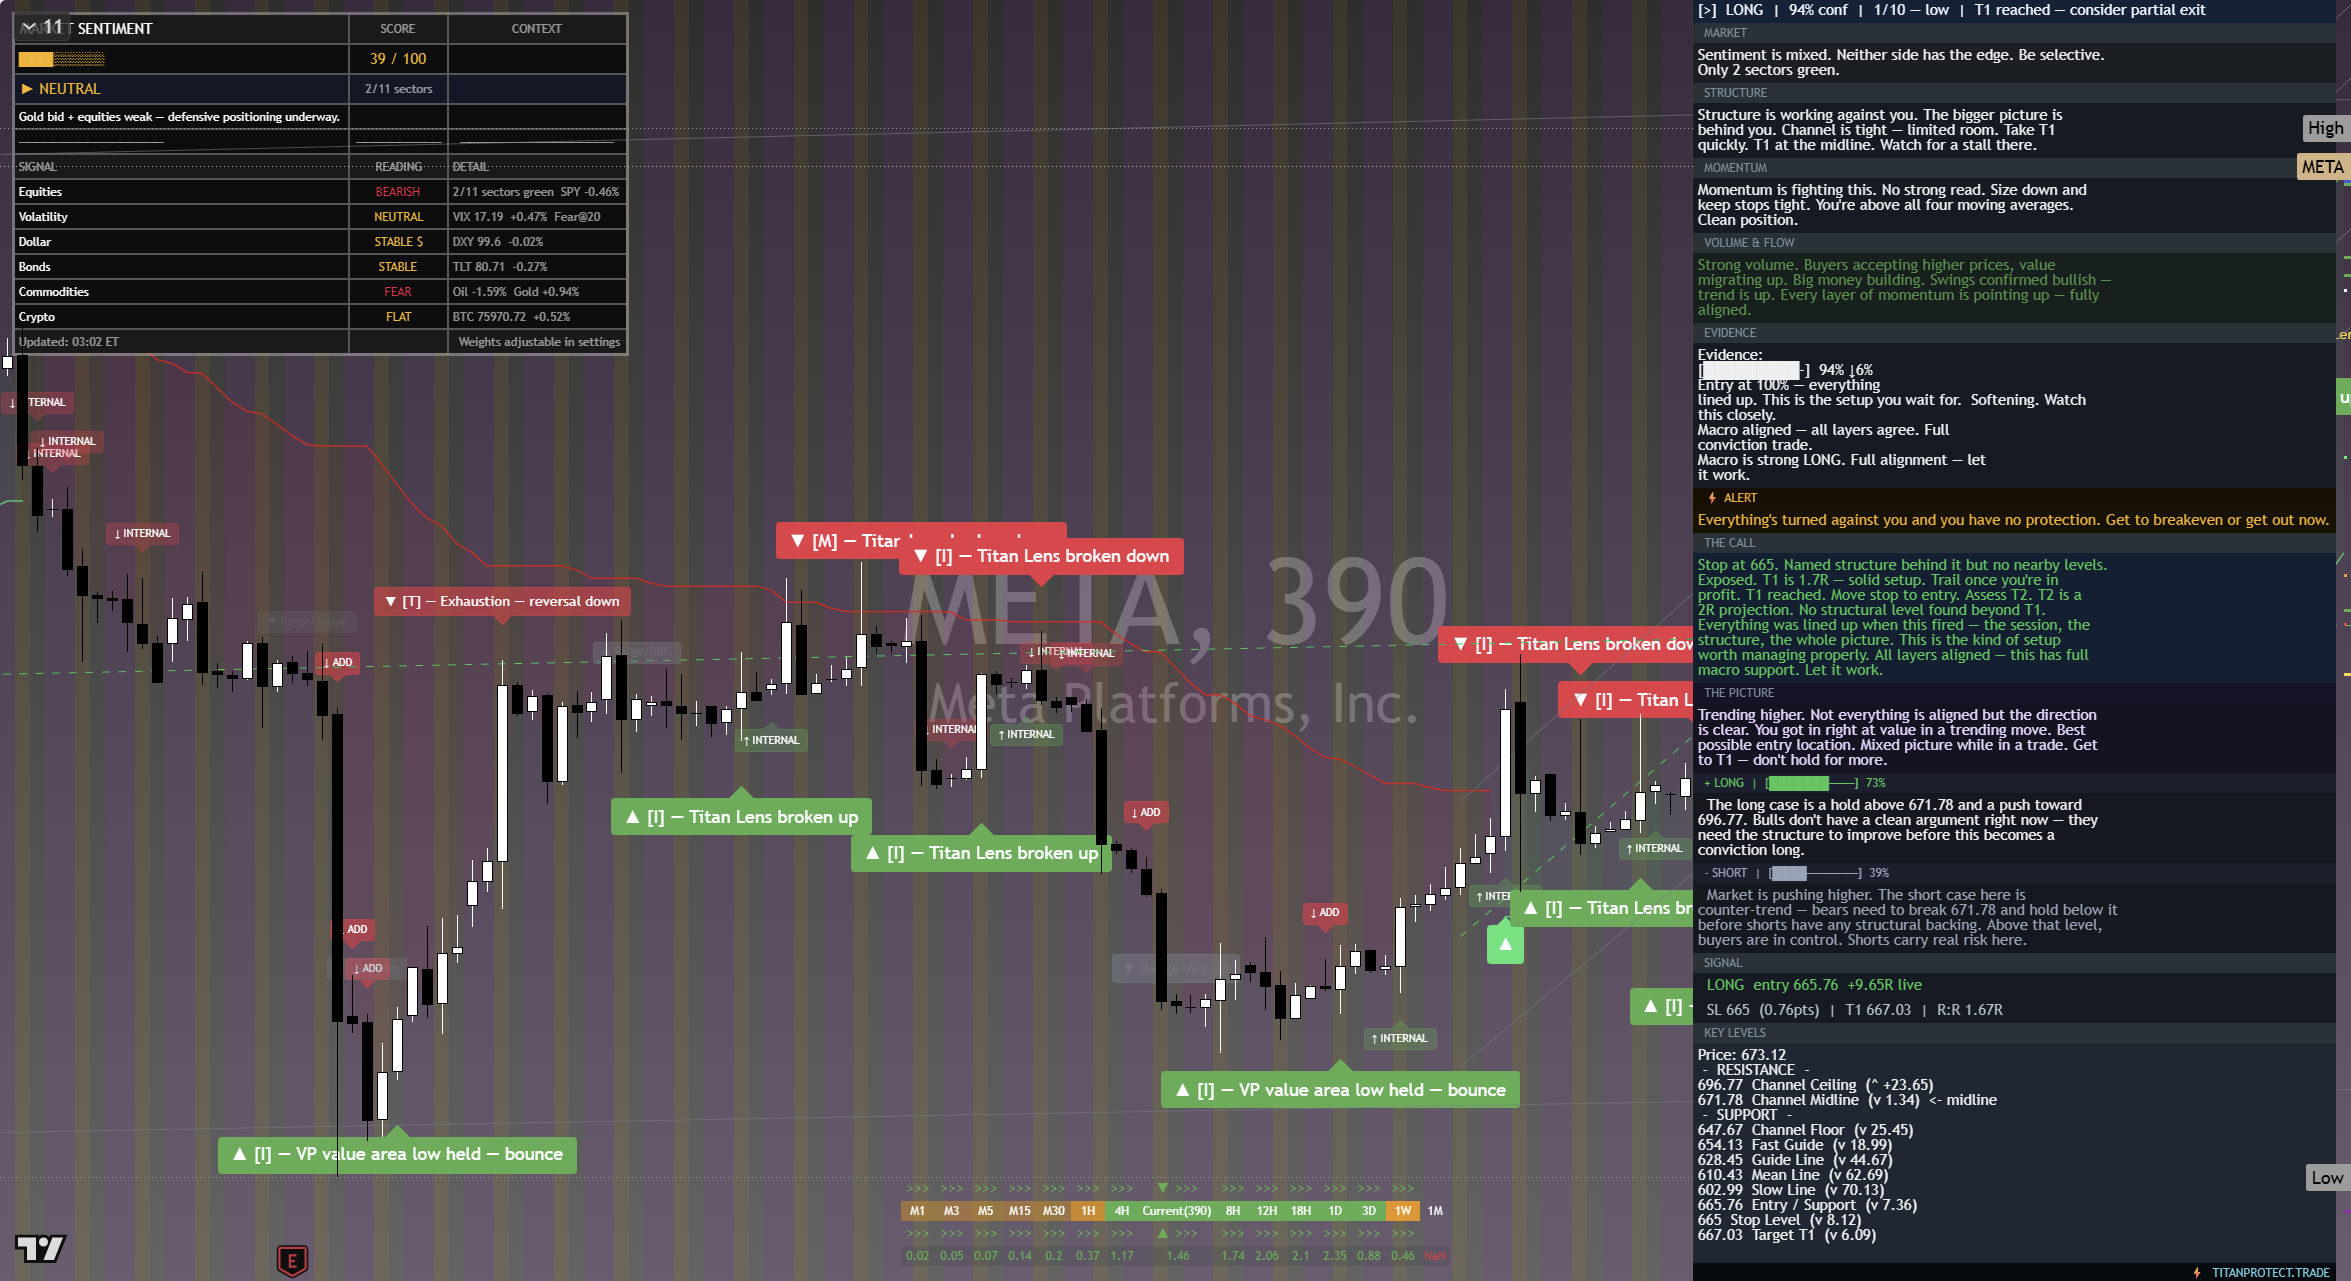
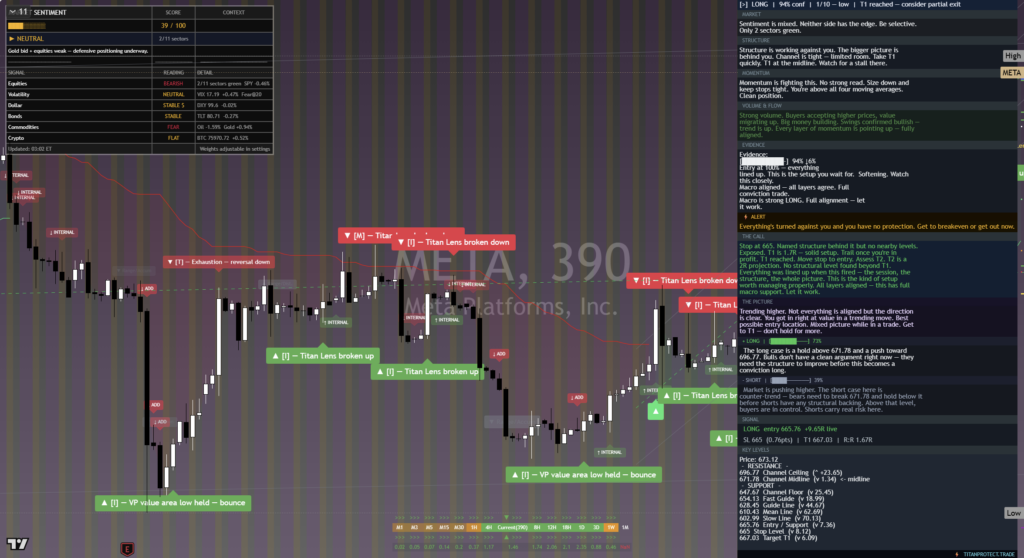
The chart above is the full daily read: structure, momentum, the levels that matter, and where the current price sits against them. Read it top to bottom for the complete picture, and pair it with our session briefs for the wider market context.
This is analysis, not financial advice. It reflects our multi-factor framework and is not a recommendation to buy or sell. Always do your own research and manage your risk.