Meta (META) – Daily Read
15 September 2026 | Stock | Titan Macro Desk
$648.03
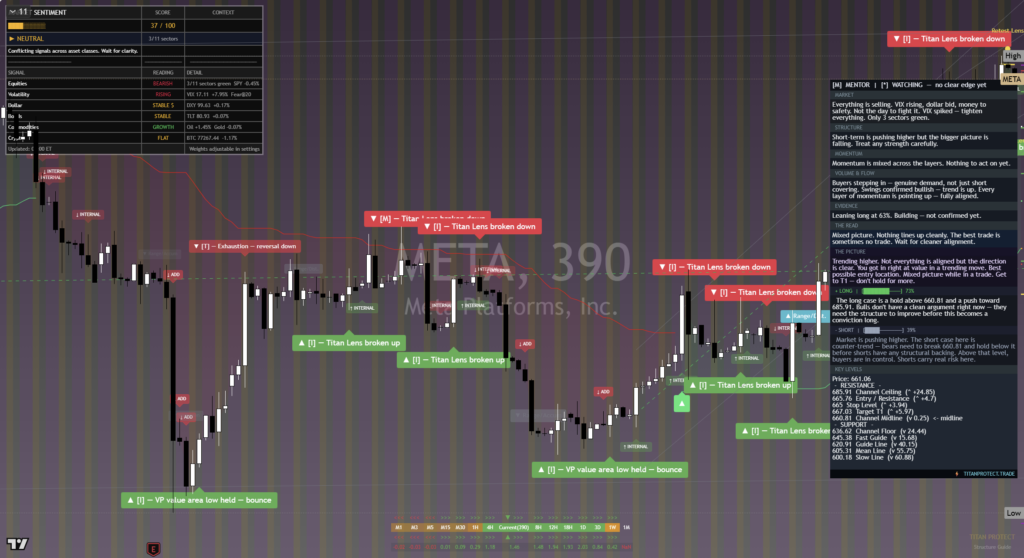
Meta is attempting a meaningful recovery, with the last price at $648.03, 0.6 percent higher on the day, and pressing the top of its one-month range. The move matters because buyers have regained control of the near-term structure, but they have not yet completed the repair. Momentum roughly 13.5 percent up over the last two weeks shows strong demand, yet price is now entering an area where conviction must replace simple rebound buying. The clear view is constructive while the nearer handles hold, but the stock still needs a clean breakout to establish that this is more than a recovery attempt.
The macro backdrop remains important because large growth stocks are sensitive to changes in expectations around interest rates, economic resilience, and spending on artificial intelligence infrastructure. Meta also carries company-specific exposure to advertising demand, engagement trends, monetization, and the cost of building out its technology ambitions. That combination can support a premium when execution is strong, but it can also amplify downside when investors question the return on spending. For the broader stock asset class, Meta’s position near the top of its recent range makes it a useful test of whether buyers still have the appetite to extend leadership rather than merely defend prior winners.
The one month average is $586.50; price is above it, and the structure reads as a recovery attempt, back above the one-month average but still under the longer one. That means the near-term trend has improved without fully resolving the larger overhead pressure. The nearer round number handles at $650.00 and $640.00 define the immediate contest. Holding around $650.00 would show that buyers can accept price near the range ceiling, while losing $640.00 would suggest the breakout effort is stalling and invite profit-taking.
The month swing high is $664.24, about 2.5 percent above the current price. This is the key supply line because sellers previously asserted control there. A decisive move above $664.24 opens the path toward $677.85, the upper boundary of the three month range $524.52 to $677.85. Acceptance above that swing high would turn recovery into a more credible continuation move. Below, a shelf of support at $537.28, about 17.1 percent below, represents the deeper level where longer-horizon buyers would need to defend the recovery thesis. Losing $537.28 exposes $524.52 and would signal that the entire rebound structure has failed.
The bull path is straightforward: if Meta holds the $650.00 and $640.00 area, absorbs supply, and then clears $664.24 decisively, then buyers have room to press toward $677.85. The bear path is equally clear: if price cannot sustain the nearer handles, then the recovery loses quality; if weakness expands through $537.28, then $524.52 becomes the next downside reference.
The main risk is false acceptance near the range top, especially if the macro environment turns less supportive or company-specific spending concerns regain attention. A sustained loss of $640.00 would weaken the immediate read, while losing $537.28 would invalidate it. Net, Meta is constructive but not confirmed: buyers have momentum, and the next proof point is a decisive break above $664.24.
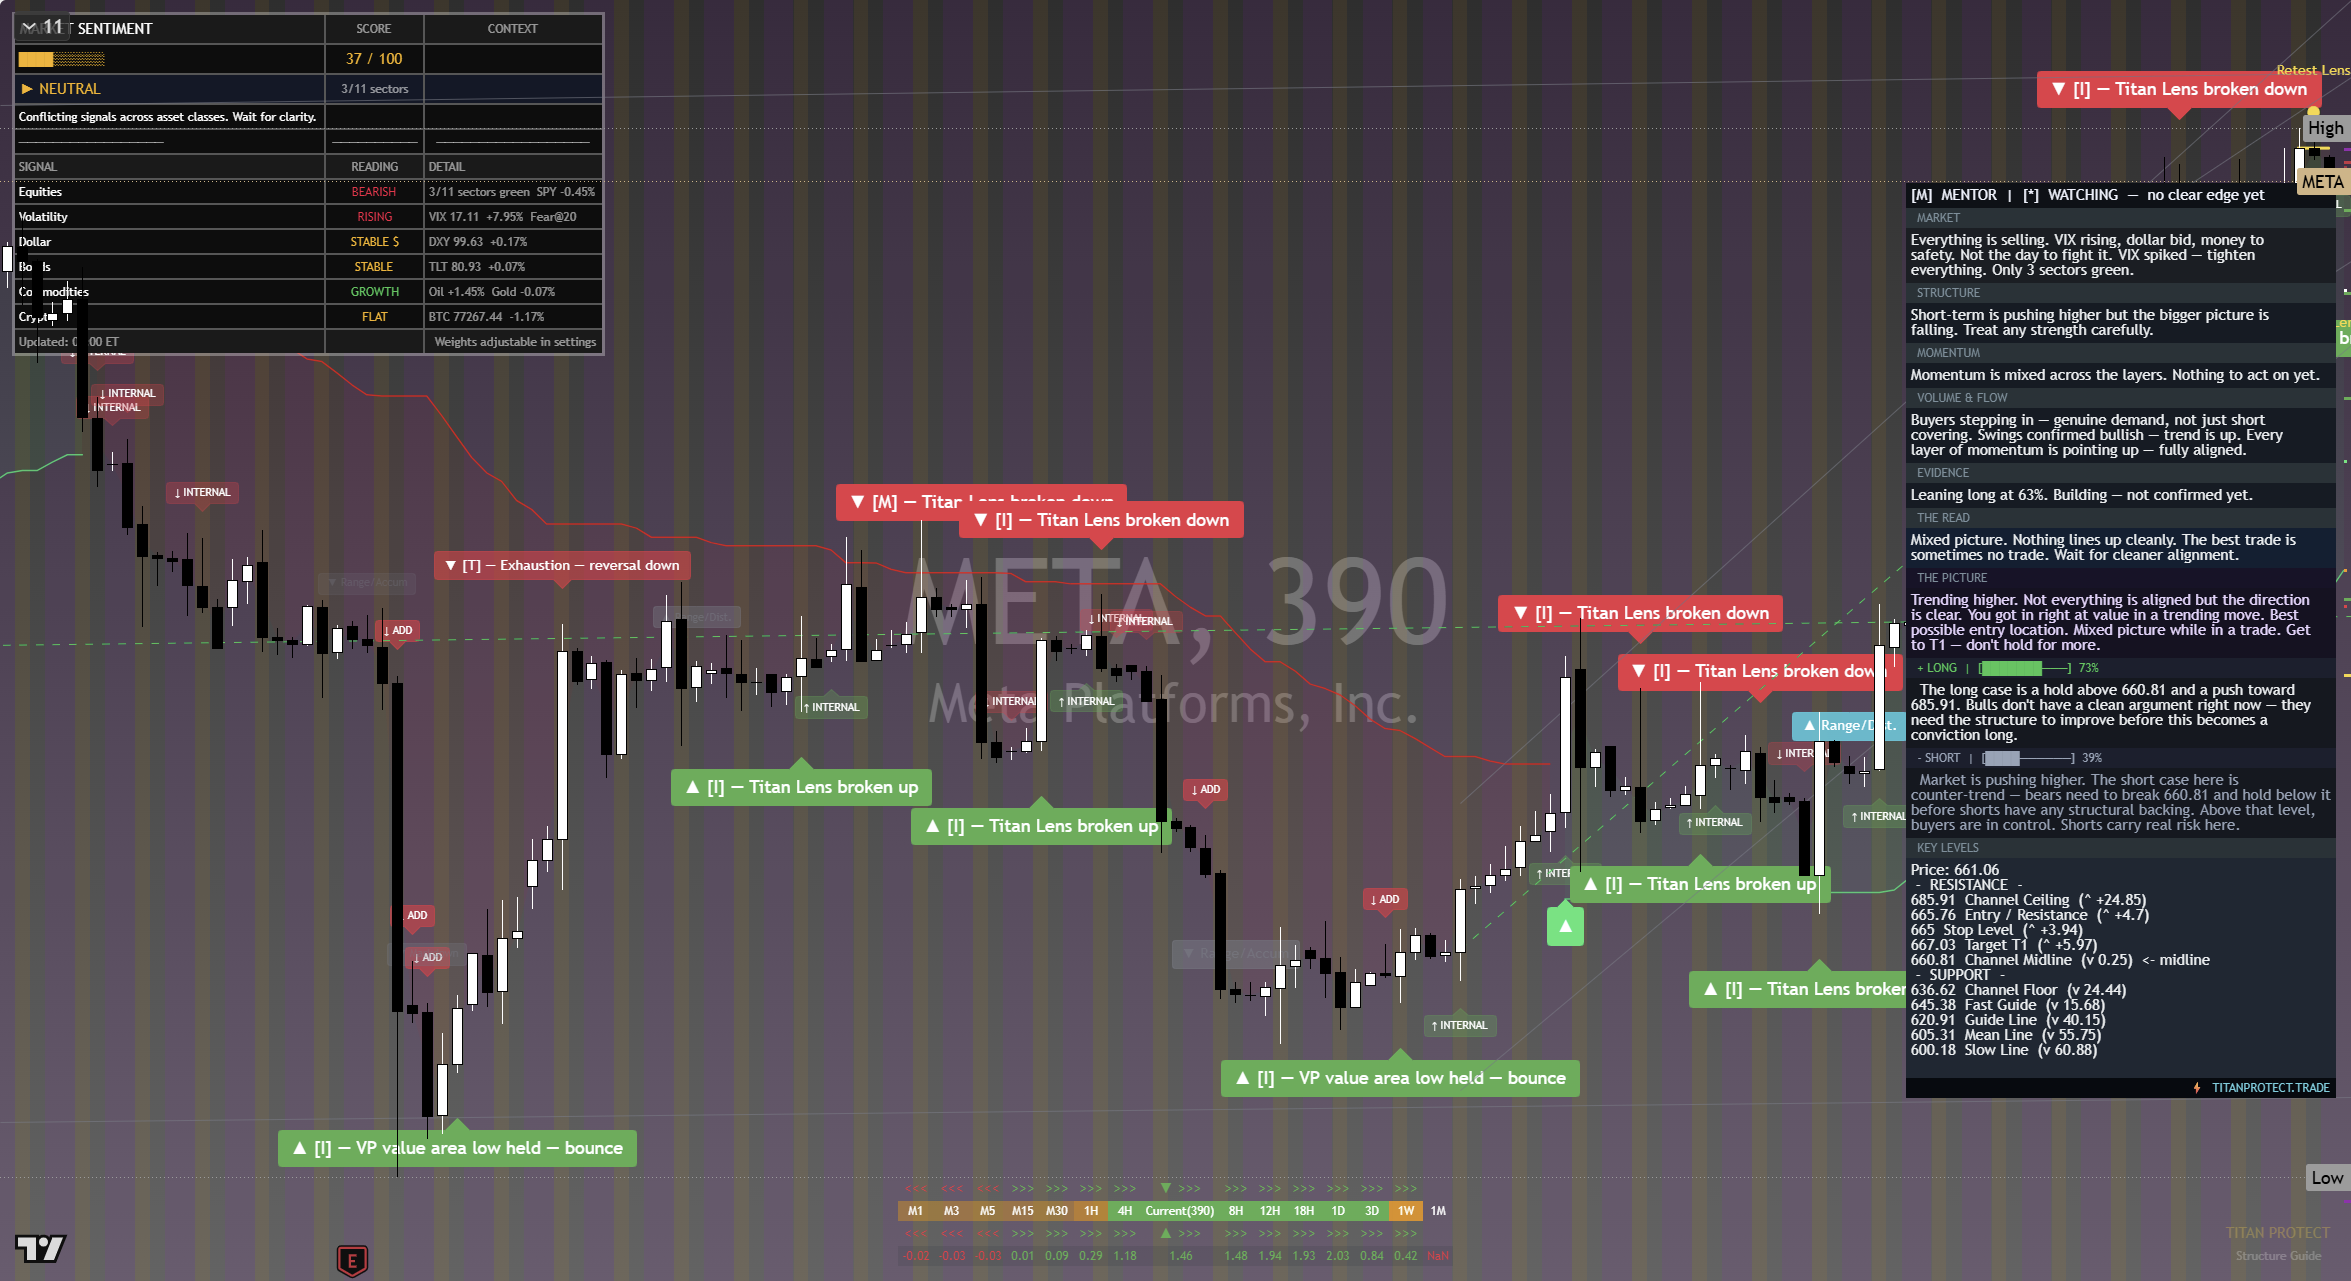
The chart above is the full daily read: structure, momentum, the levels that matter, and where the current price sits against them. Read it top to bottom for the complete picture, and pair it with our session briefs for the wider market context.
This is analysis, not financial advice. It reflects our multi-factor framework and is not a recommendation to buy or sell. Always do your own research and manage your risk.