Meta (META) – Daily Read
14 September 2026 | Stock | Titan Macro Desk
$648.03
On 14 September 2026, Meta is attempting to turn a strong rebound into a broader trend recovery. Last price is $648.03, 0.6 percent higher on the day, and it is pressing the top of its one-month range. The near-term bias is constructive because buyers have regained control of recent price action, but the stock is entering an area where conviction must replace recovery momentum. The clear view is cautiously bullish while price holds the nearby handles, with confirmation still required above the monthly peak.
The wider market backdrop matters through risk appetite, growth expectations, and the valuation investors are willing to place on large technology companies. Meta carries additional sensitivity to digital advertising demand, spending discipline, artificial intelligence investment, and confidence that heavy infrastructure expenditure will produce durable returns. The one month average is $586.50; price is above it, and the structure reads as a recovery attempt, back above the one-month average but still under the longer one. That distinction is important. Shorter-term buyers are in control, but the longer-term structure has not fully confirmed the turn. The roughly 13.5 percent gain over the last two weeks also means positioning may be less forgiving if fresh demand fails to appear.
The immediate decision zone is formed by the nearer round number handles at $650.00 and $640.00. Holding above $650.00 would show that buyers can absorb profit-taking near a psychologically important price and sustain acceptance at the top of the recent range. A retreat below $640.00 would suggest the breakout effort is losing force and could encourage recent buyers to reduce exposure. The month swing high is $664.24, about 2.5 percent above the current price. This is the main confirmation level because it marks the point where recent supply previously stopped the advance. A decisive move above $664.24 opens the path toward $677.85.
The three month range is $524.52 to $677.85, making the upper boundary the next meaningful test if the month swing high gives way. Reaching that area would show the recovery has expanded beyond the short-term range, although sellers could defend it as the established three-month ceiling. On the downside, a shelf of support sits at $537.28, about 17.1 percent below. It matters because buyers have previously established a firmer base there. Losing $537.28 exposes $524.52 and would convert the recovery attempt into a failed advance within the broader range.
The bull path is straightforward: if Meta holds $640.00, establishes itself above $650.00, and then clears $664.24 decisively, buyers should have room to challenge $677.85. The bear path begins if repeated rejection near the range top pushes price through $640.00. If selling then deepens enough to break $537.28, the market would likely test $524.52.
The principal risk to the bullish read is that the recent rise reflects short-term repositioning rather than durable demand. Failure to hold the nearby handles, especially after testing the monthly high, would invalidate the immediate continuation case. Net, Meta has bullish near-term control, but the decisive proof lies above $664.24, while the deeper structure remains protected only as long as $537.28 holds.
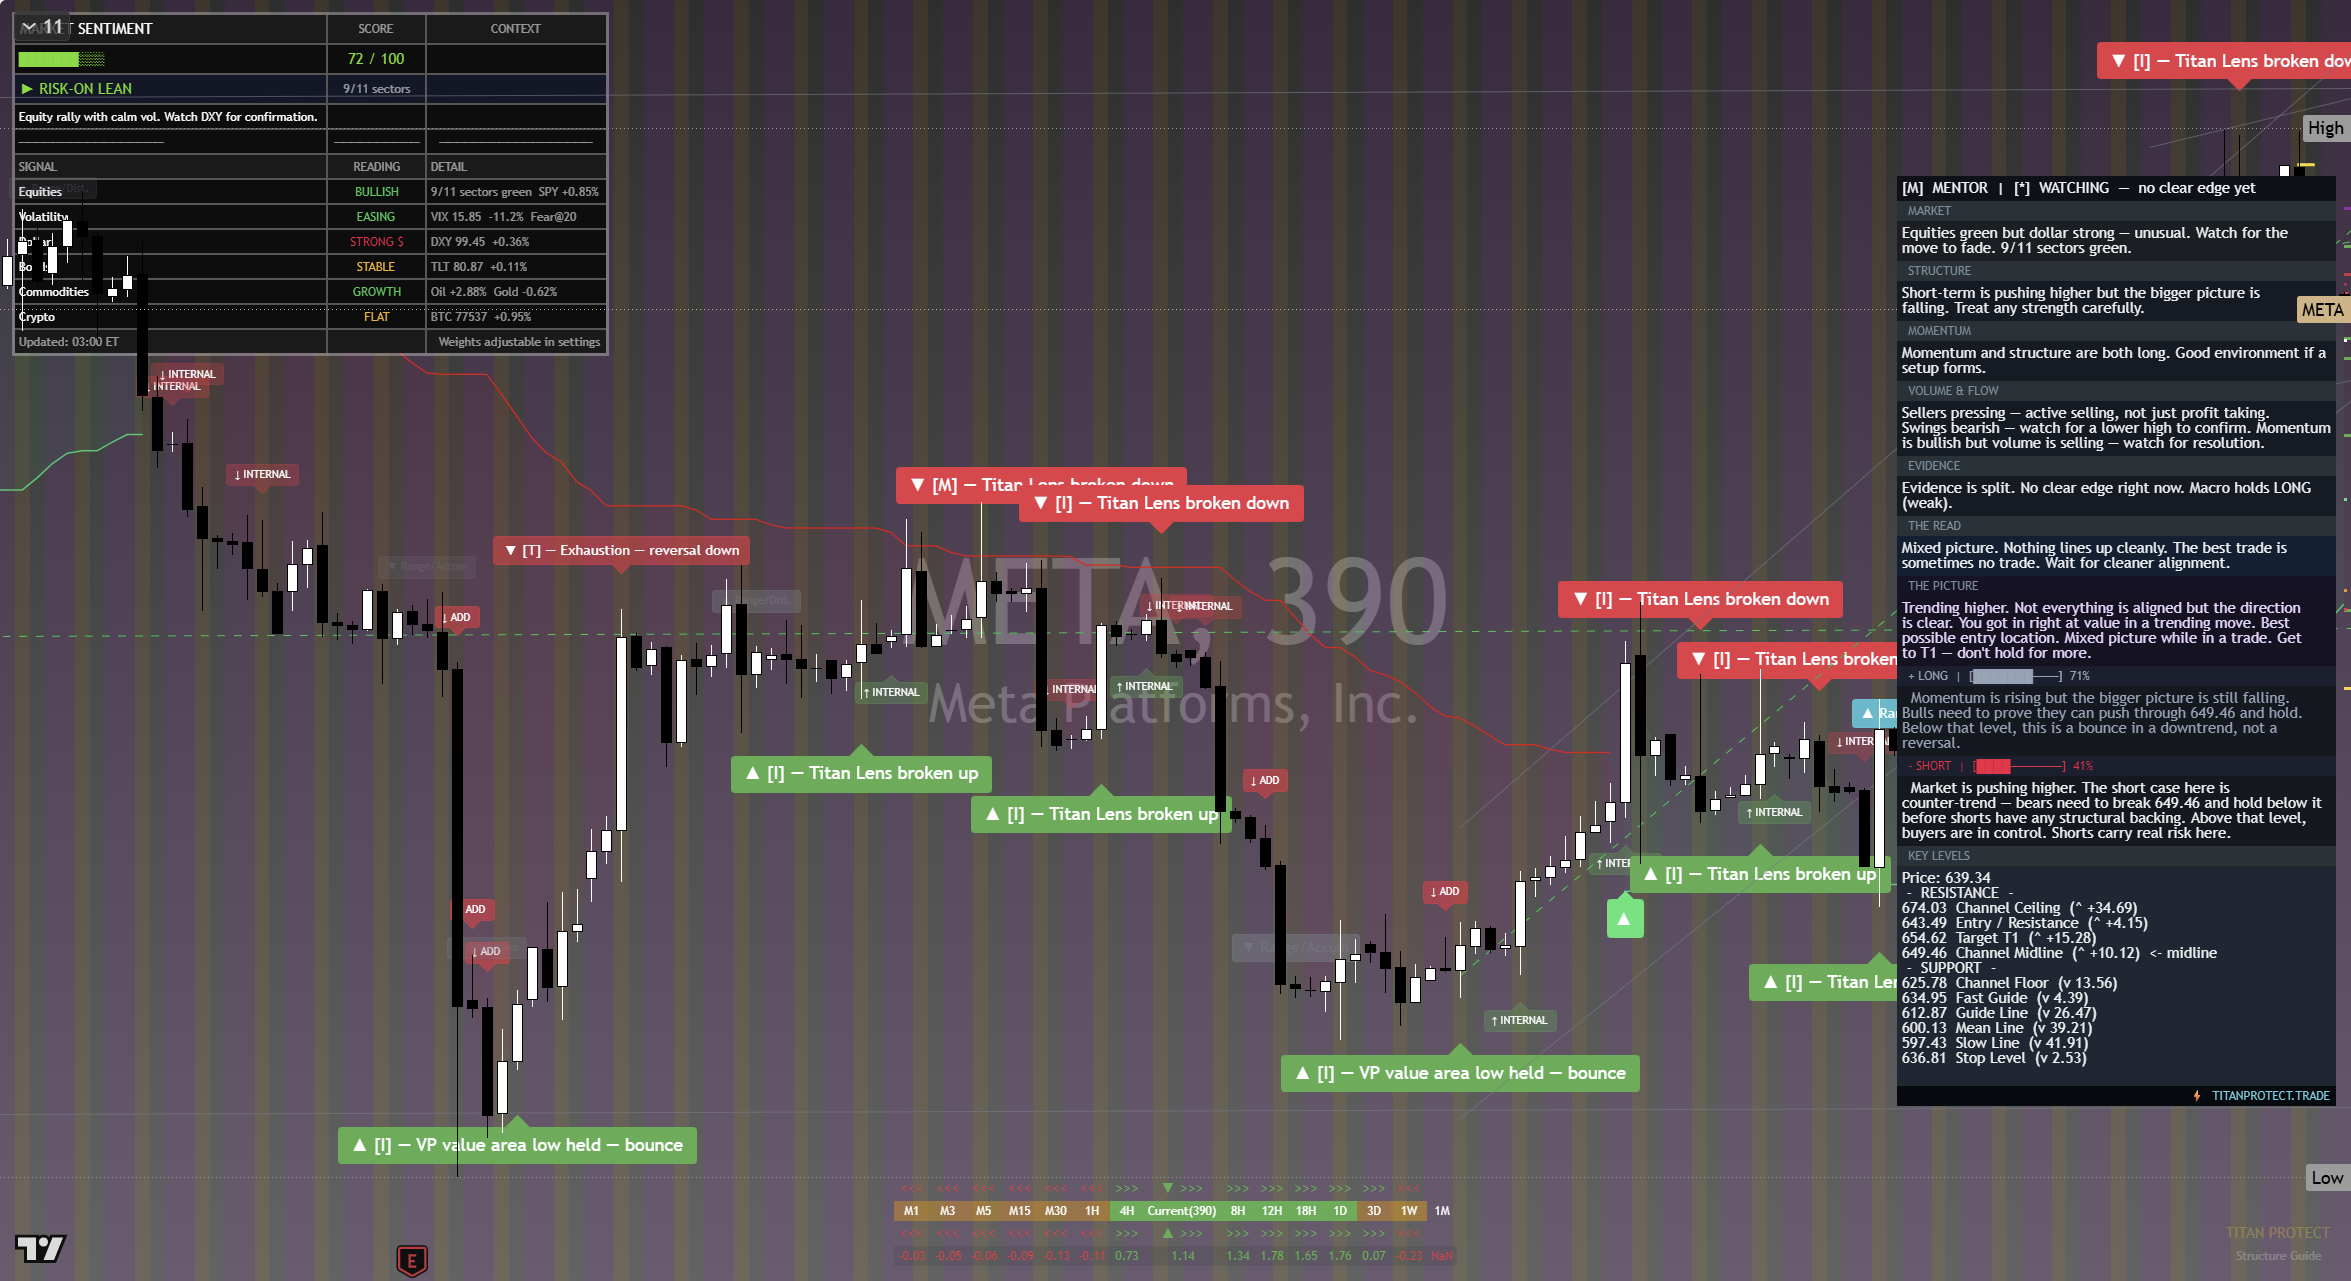
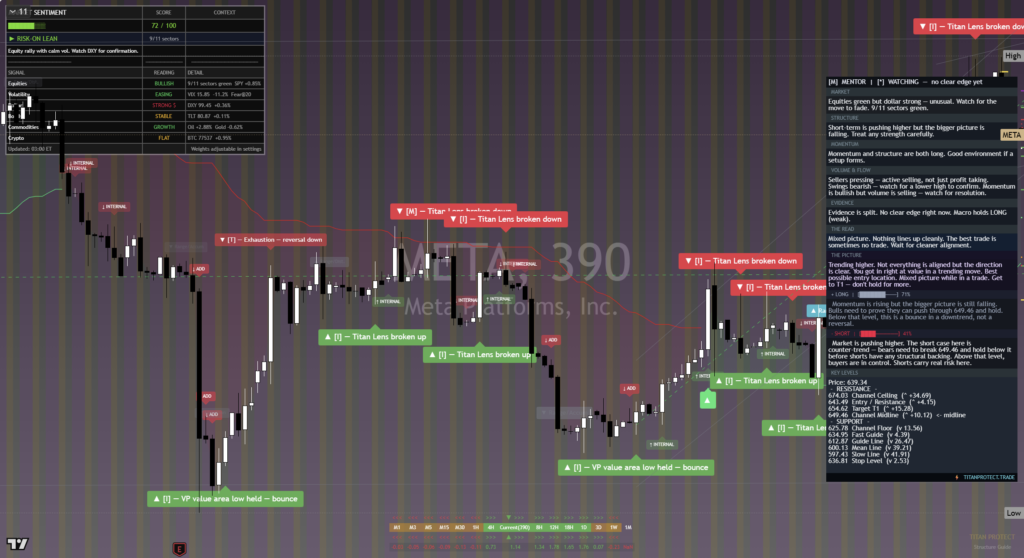
The chart above is the full daily read: structure, momentum, the levels that matter, and where the current price sits against them. Read it top to bottom for the complete picture, and pair it with our session briefs for the wider market context.
This is analysis, not financial advice. It reflects our multi-factor framework and is not a recommendation to buy or sell. Always do your own research and manage your risk.