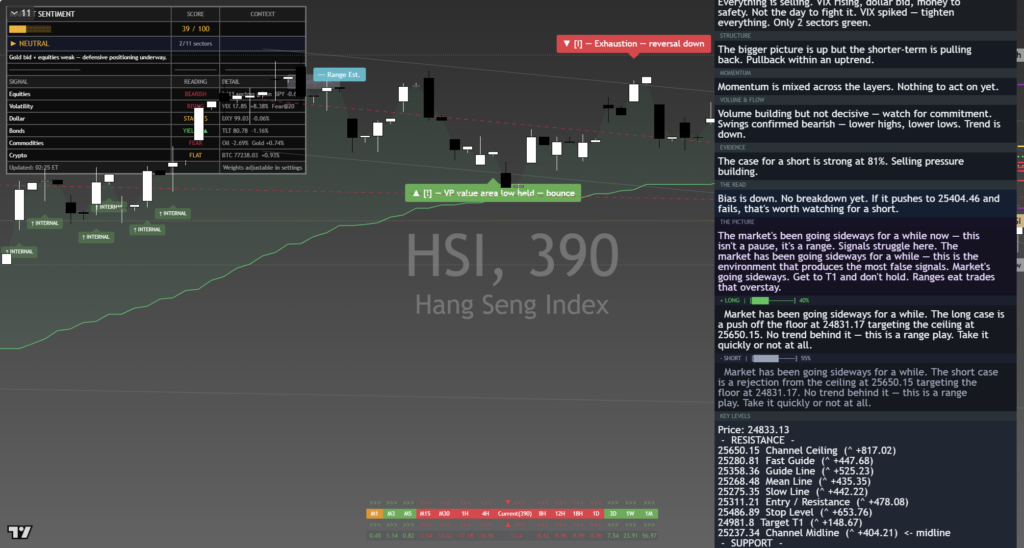
Hang Seng (HSI) – Daily Read
11 September 2026 | Index | Titan Macro Desk
24,790.9
Hang Seng is in a controlled pullback rather than a confirmed trend reversal, but the burden has shifted to buyers to defend nearby support. Last price 24,791, 0.7 percent lower on the day, leaves the index down near the floor of its one-month range and vulnerable to another leg lower if demand does not return quickly. The clear view is cautiously constructive beyond the immediate weakness: the longer trend still points up, but near-term price action must stabilize before that broader direction can reassert itself.
The macro backdrop matters because Hong Kong equities remain highly sensitive to expectations around Chinese growth, policy support, liquidity, and the global appetite for risk. Uncertainty in any of those areas can keep investors defensive, particularly when the index is already losing momentum. Momentum roughly 3.0 percent down over the last two weeks confirms that sellers currently control the short-term tape. The one month average 25,476 is therefore an important dividing line. Price is below it, and the structure reads as a pullback, slipping under the one-month average while the longer trend still points up. A recovery through that average would suggest selling pressure is being absorbed. Continued rejection beneath it would keep the correction active.
The nearer round number handles at 25,000 and 24,500 frame the immediate battle. Reclaiming 25,000 would be the first evidence that buyers can convert a psychological ceiling back into support, improving the chance of a push toward the one month average 25,476. Below the market, a shelf of support at 24,570, about 0.9 percent below, is the more consequential defence. That shelf sits close enough to 24,500 for the area to attract both tactical demand and stop-driven volatility. Holding it would preserve the pullback interpretation. Losing it would show that the market is no longer merely consolidating near the range floor.
On the upside, the month swing high 26,009, about 4.9 percent above the current price, is the key confirmation point. If the index regains 25,000, clears 25,476, and sustains demand through 26,009, then the pullback has likely reset rather than broken the advance. A decisive move above 26,009 opens the path toward 26,391, the upper boundary of the three month range 23,226 to 26,391. That sequence would signal renewed acceptance at higher prices, not just a short-covering bounce.
The bear path is equally clear. If 24,570 fails and attempts to recover 24,500 are rejected, then sellers have converted support into resistance and the downside can expand. Losing 24,570 exposes 23,226, where the lower boundary of the broader range becomes the next meaningful test. The read would be invalidated on the bullish side by sustained trade above 26,009, and on the bearish side by a clean loss of 24,570 followed by failure to recover it. Net, the larger trend remains constructive, but the immediate setup is defensive until buyers reclaim 25,000 and then 25,476.
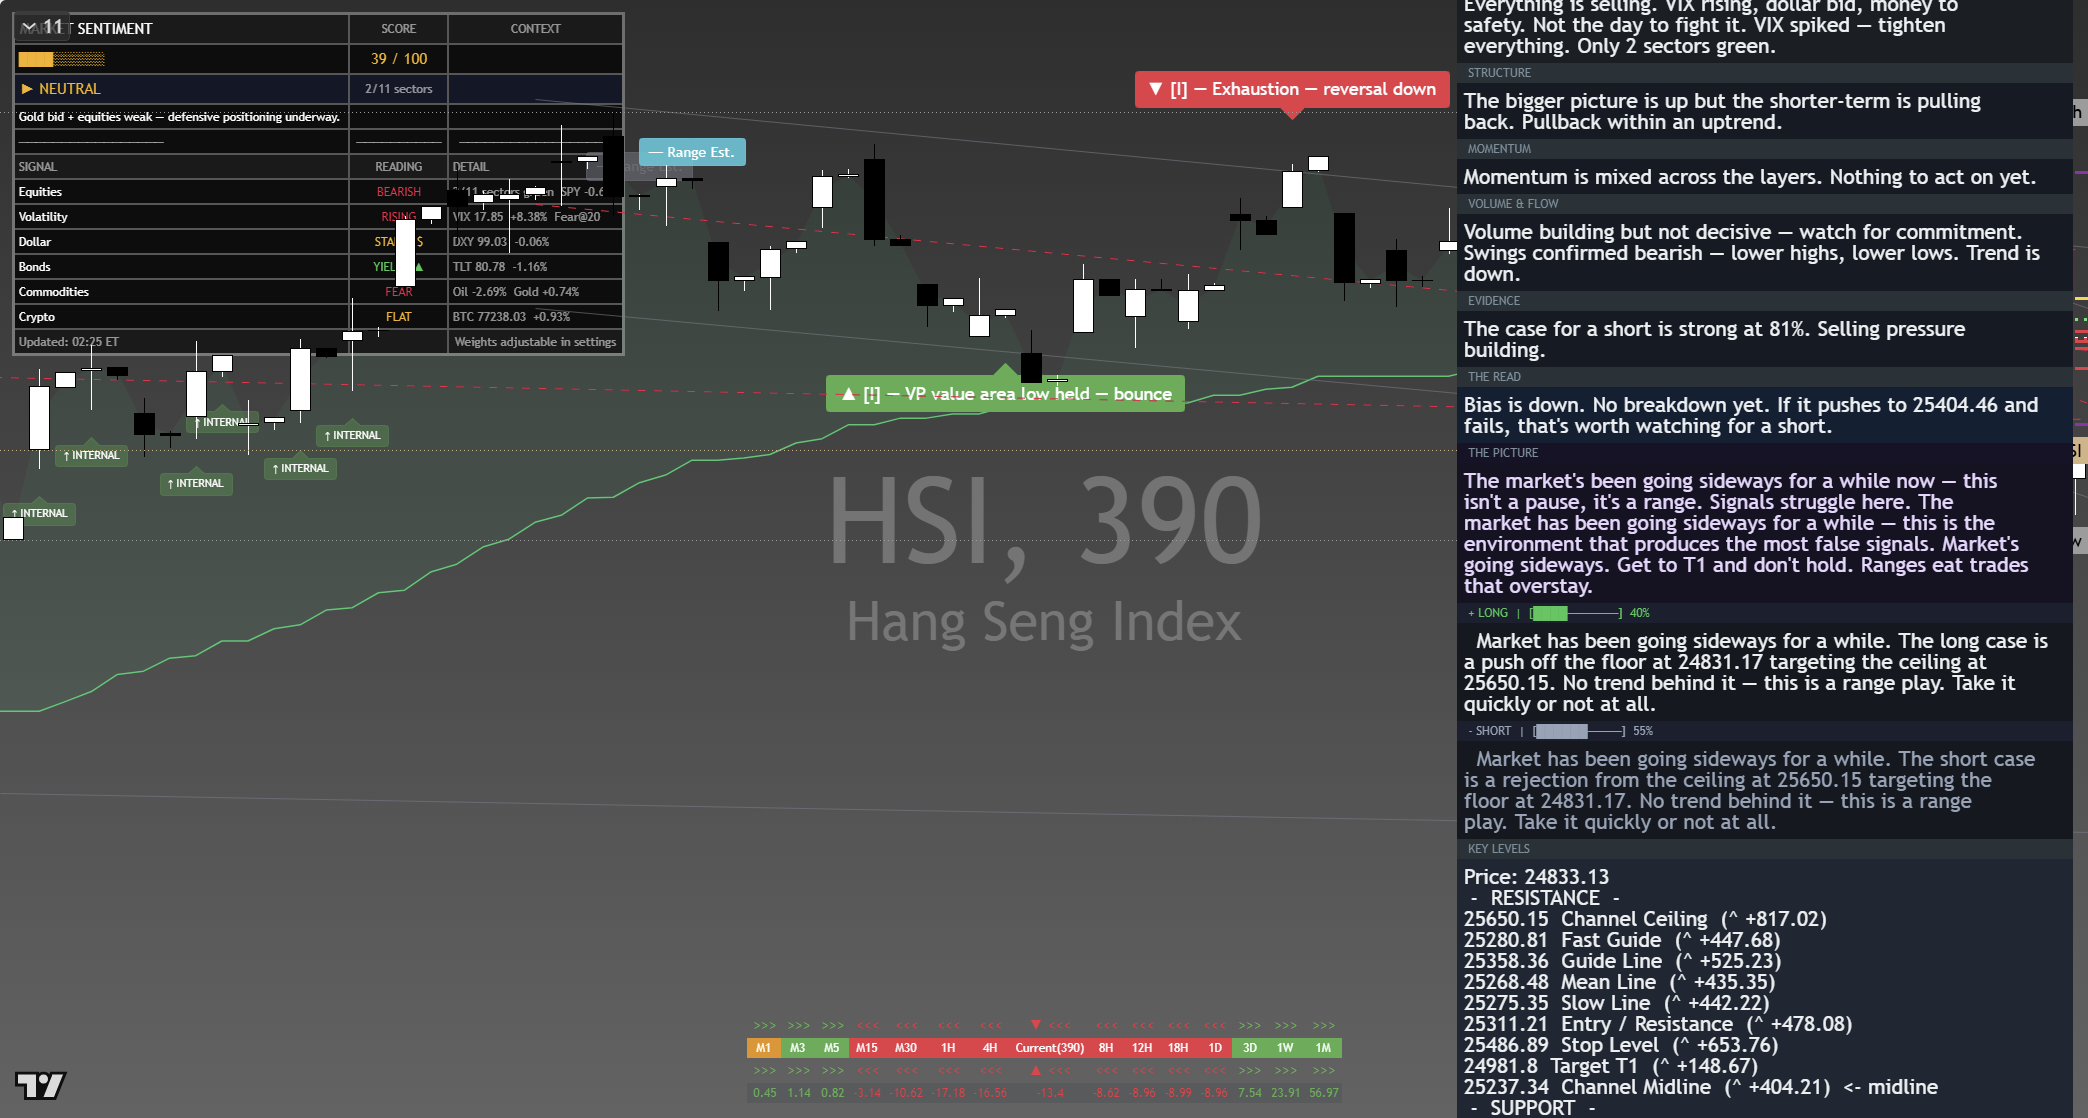
The chart above is the full daily read: structure, momentum, the levels that matter, and where the current price sits against them. Read it top to bottom for the complete picture, and pair it with our session briefs for the wider market context.
This is analysis, not financial advice. It reflects our multi-factor framework and is not a recommendation to buy or sell. Always do your own research and manage your risk.