Gold (XAU/USD) – Daily Read
14 September 2026 | Commodity | Titan Macro Desk
$4,371.90
Gold is correcting within a broader uptrend, but the immediate balance of risk remains tilted lower until buyers reclaim lost ground. Last price $4,372, 0.0 percent lower on the day. It is down near the floor of its one-month range. That matters because a market resting near its recent floor is vulnerable to another liquidation wave, even when the larger structure remains constructive. The current weakness looks more like an unresolved pullback than a confirmed trend reversal, but buyers now need to prove that distinction.
The macro tension is straightforward. Firm economic activity, inflation pressure from energy, rising bond yields, and expectations of tighter Federal Reserve policy increase the cost of holding gold and can support the dollar, creating a difficult near-term backdrop. At the same time, geopolitical uncertainty, concern around fiscal credibility, and continued strategic demand for gold preserve its longer-term defensive appeal. That conflict explains why the metal can remain structurally supported while suffering a sharp tactical retreat. Momentum roughly 3.0 percent down over the last two weeks confirms that sellers currently control the shorter horizon. [World Gold Council](https://www.gold.org/goldhub/gold-focus/2026/09/weekly-markets-monitor-treasury-tribalism) and [Reuters](https://www.marketscreener.com/news/gold-falls-as-dollar-yields-rise-ahead-of-inflation-data-ce785bdedc8cfe22) reporting supports this mix of policy pressure, higher yields, and persistent geopolitical demand.
One month average $4,519; price is below it, and the structure reads as a pullback, slipping under the one-month average while the longer trend still points up. That area matters because recovering it would show that the recent decline is being absorbed rather than merely paused. Nearer round number handles at $4,400 and $4,300 frame the immediate contest. Holding above the lower handle would preserve orderly consolidation, while sustained trade above the upper handle would begin rebuilding buyer confidence.
A shelf of support at $4,333, about 0.9 percent below. This is the critical nearby defence because buyers must absorb forced selling there to prevent the pullback from broadening. Three month range $3,990 to $4,755. The lower boundary represents the deeper structural line, while the upper boundary is where supply previously overwhelmed demand. Month swing high $4,755, about 8.8 percent above the current price. A return there would therefore require both repaired momentum and a meaningful change in the policy or dollar backdrop.
The bull path is clear: if $4,333 holds, then acceptance above $4,400 can support a recovery toward $4,519. If buyers subsequently absorb supply at the range ceiling, a decisive move above $4,755 opens the path toward $4,855. The bear path is equally direct: if rebounds fail beneath $4,400 and selling presses through nearby support, then losing $4,333 exposes $3,990.
The main risk to the bullish interpretation is persistent upward pressure on yields and the dollar, which would make the pullback deeper and invalidate the idea that nearby support can contain it. The bearish read would be invalidated by a firm recovery through $4,519 followed by sustained demand into the range ceiling. Net, the longer trend still deserves respect, but below the one-month average and near range support, gold remains a defend-first market rather than a chase.
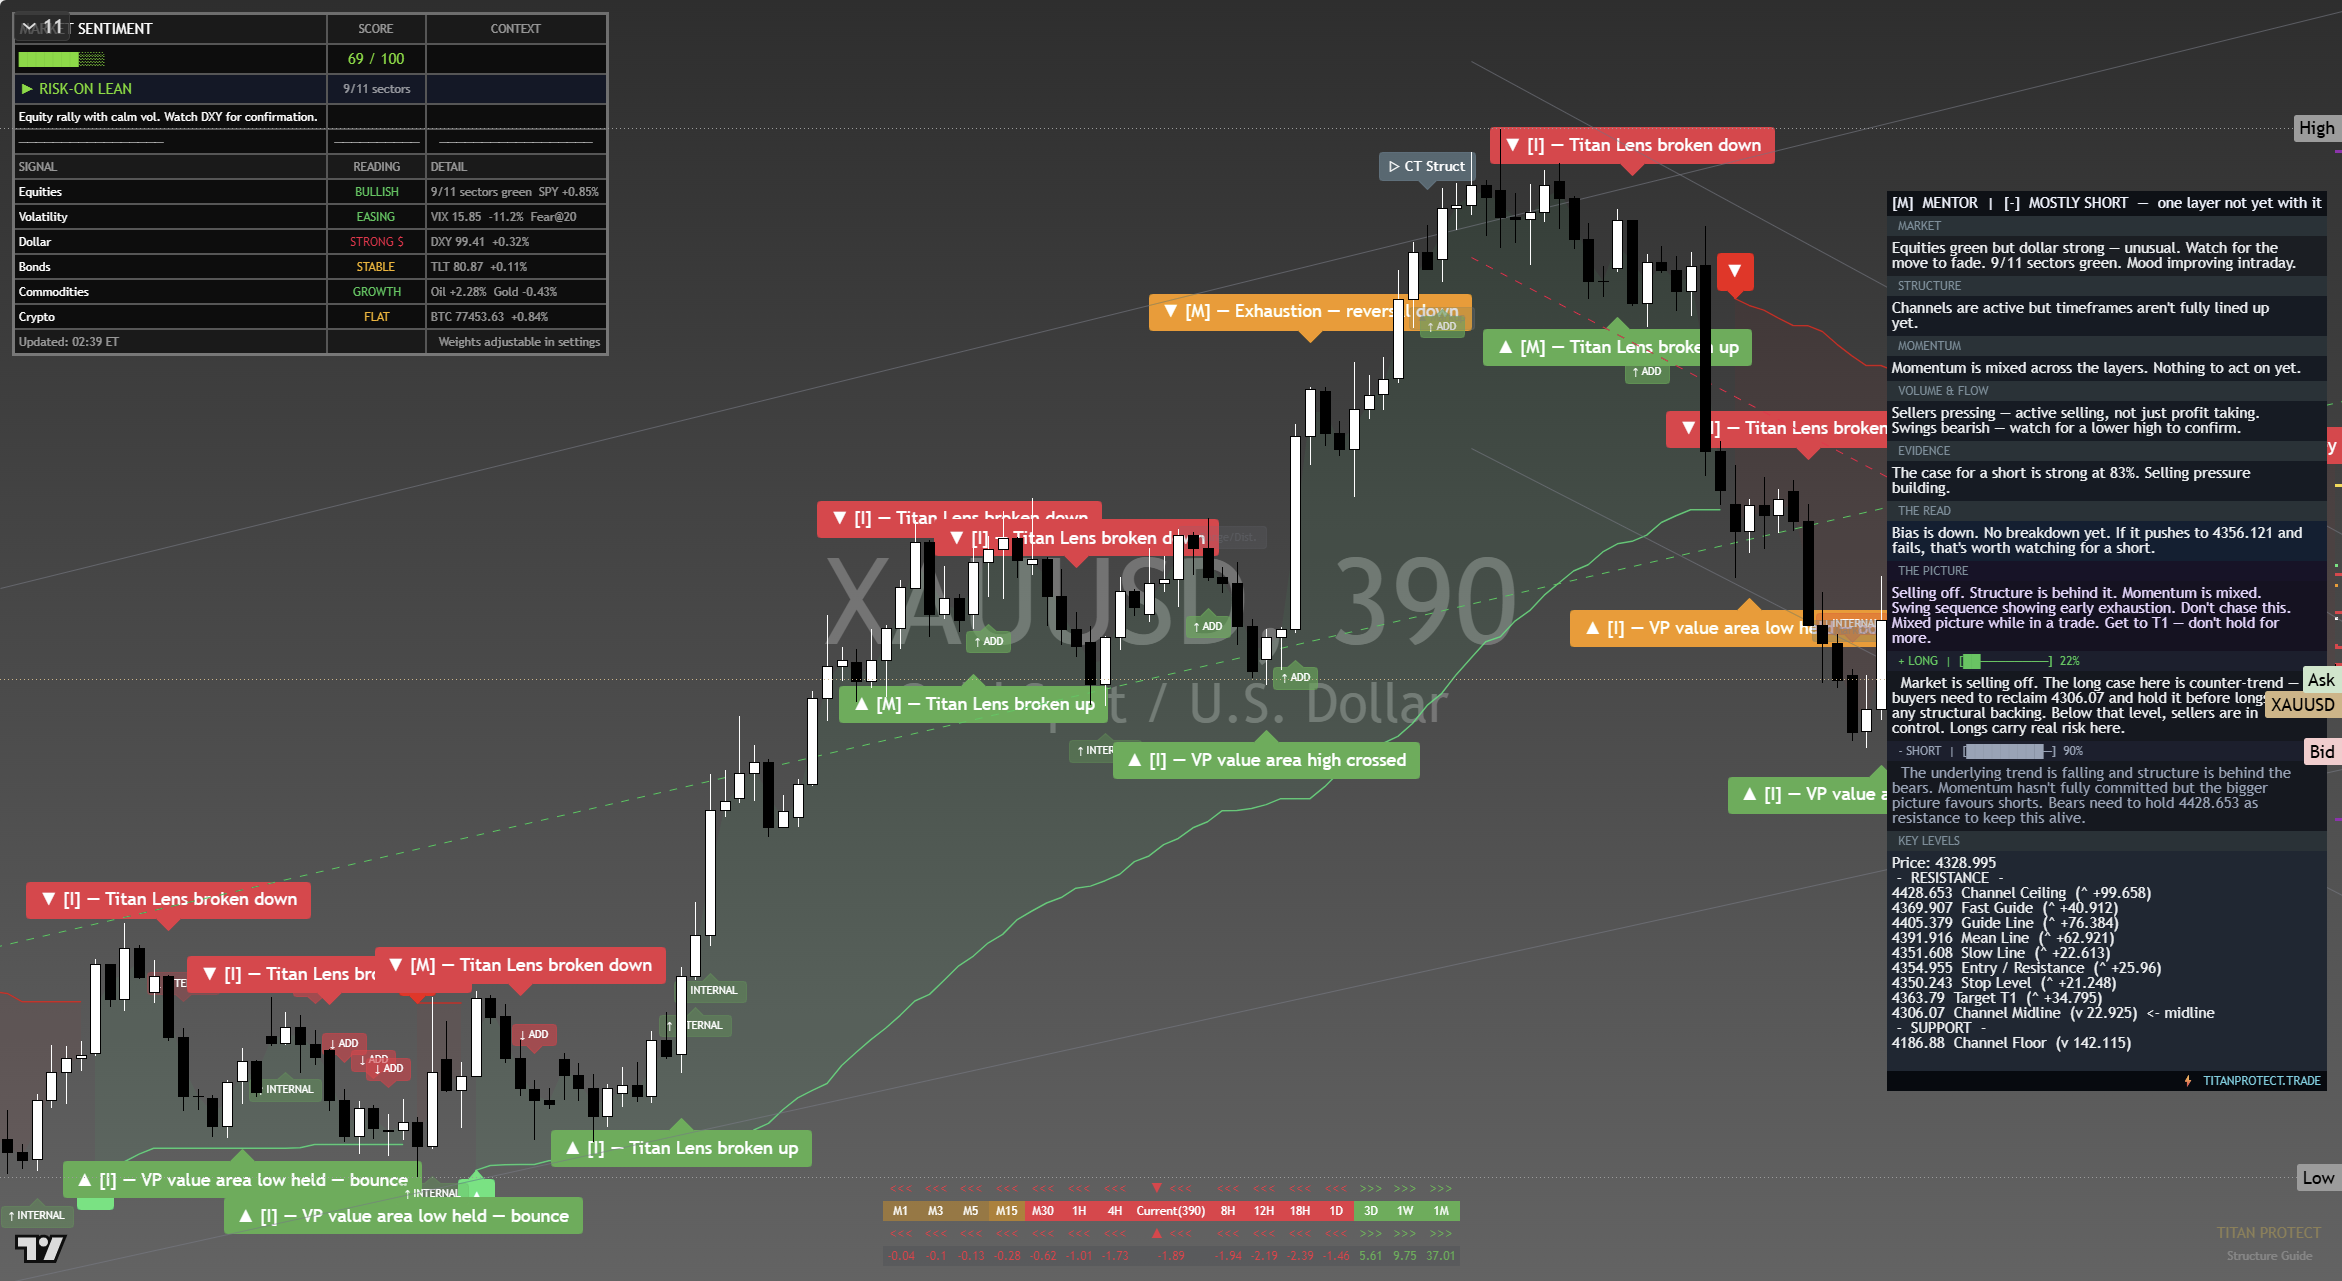
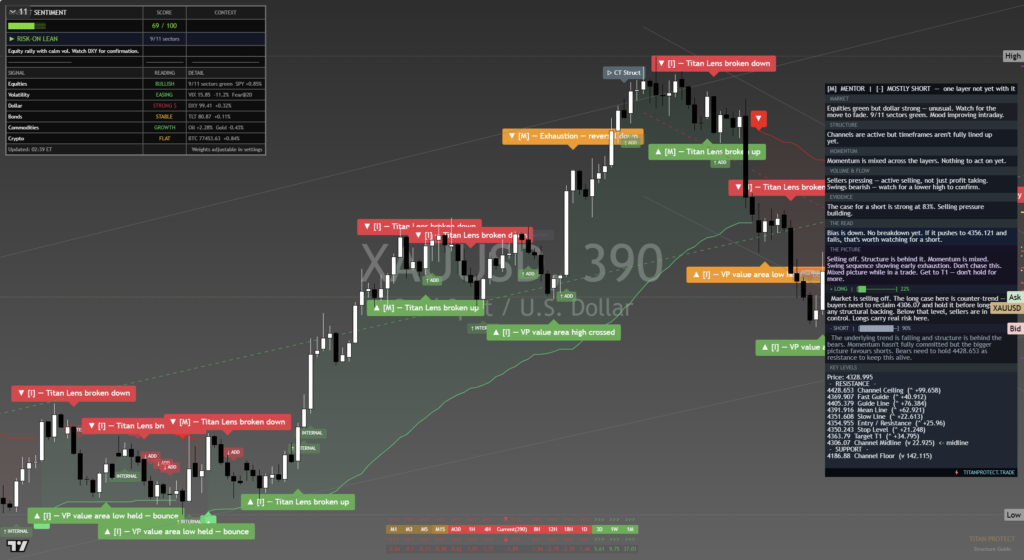
The chart above is the full daily read: structure, momentum, the levels that matter, and where the current price sits against them. Read it top to bottom for the complete picture, and pair it with our session briefs for the wider market context.
This is analysis, not financial advice. It reflects our multi-factor framework and is not a recommendation to buy or sell. Always do your own research and manage your risk.