Gold (XAU/USD) – Daily Read
10 September 2026 | Commodity | Titan Macro Desk
$4,444.00
Gold is correcting within a broader upward trend, and the distinction matters. Last price is $4,444, 0.0 percent lower on the day. That flat daily change masks a more meaningful loss of momentum, with the metal roughly 5.8 percent down over the last two weeks. It is trading in the lower half of its one-month range, showing that sellers retain near-term control even though the longer trend still points up. The clear view is cautious below the recent range midpoint, but not structurally bearish while nearby support holds.
The macro backdrop remains a tug of war between gold’s defensive appeal and the pressure created when the dollar and real yields become more attractive. Demand for protection against policy uncertainty, geopolitical risk, and currency debasement supports the asset class, while changing rate expectations can force rapid position reductions. Gold’s specific catalyst is therefore the interaction between those forces and its recent loss of price traction. The one month average is $4,537; price is below it, and the structure reads as a pullback, slipping under the one-month average while the longer trend still points up. Until that average is recovered, rallies can attract sellers looking to reduce exposure.
The nearer round number handles at $4,500 and $4,400 frame the immediate contest. Reclaiming $4,500 would show that buyers are absorbing supply and beginning to repair the pullback, while continued failure there would keep the market heavy. The $4,400 handle is the near-term psychological defence. Holding it preserves scope for stabilization, but repeated trading below it would increase pressure on a shelf of support at $4,366, about 1.8 percent below. That shelf matters because it separates an orderly correction from a deeper retracement. The three month range is $3,990 to $4,755, making $4,366 the key barrier protecting the lower boundary. Above, the month swing high is $4,755, about 7.0 percent above the current price. It represents both the limit of the recent advance and the supply that must be cleared before trend continuation is confirmed.
The bull path is straightforward: if $4,400 holds, then a recovery through $4,500 can challenge the one month average at $4,537. If buyers establish control above that area, then the pullback starts to look complete and attention returns to $4,755. A decisive move above $4,755 opens the path toward $4,855, signalling renewed expansion of the longer uptrend. The bear path begins if rebounds fail beneath $4,500 and price presses through $4,400. If that weakness leads to losing $4,366, then the correction is no longer contained and losing $4,366 exposes $3,990.
The main risk to the cautious view is a forceful recovery above $4,537, which would invalidate the assumption that sellers still control the near term. Conversely, the longer-term bullish structure is invalidated by sustained weakness through $4,366, because that would shift the market from consolidation toward range retracement. Net, gold remains in an upward larger structure but is not yet behaving like a clean buy-the-dip market. Respect the pullback below $4,537, watch whether $4,400 and $4,366 absorb supply, and require a recovery through resistance before treating the advance as renewed.
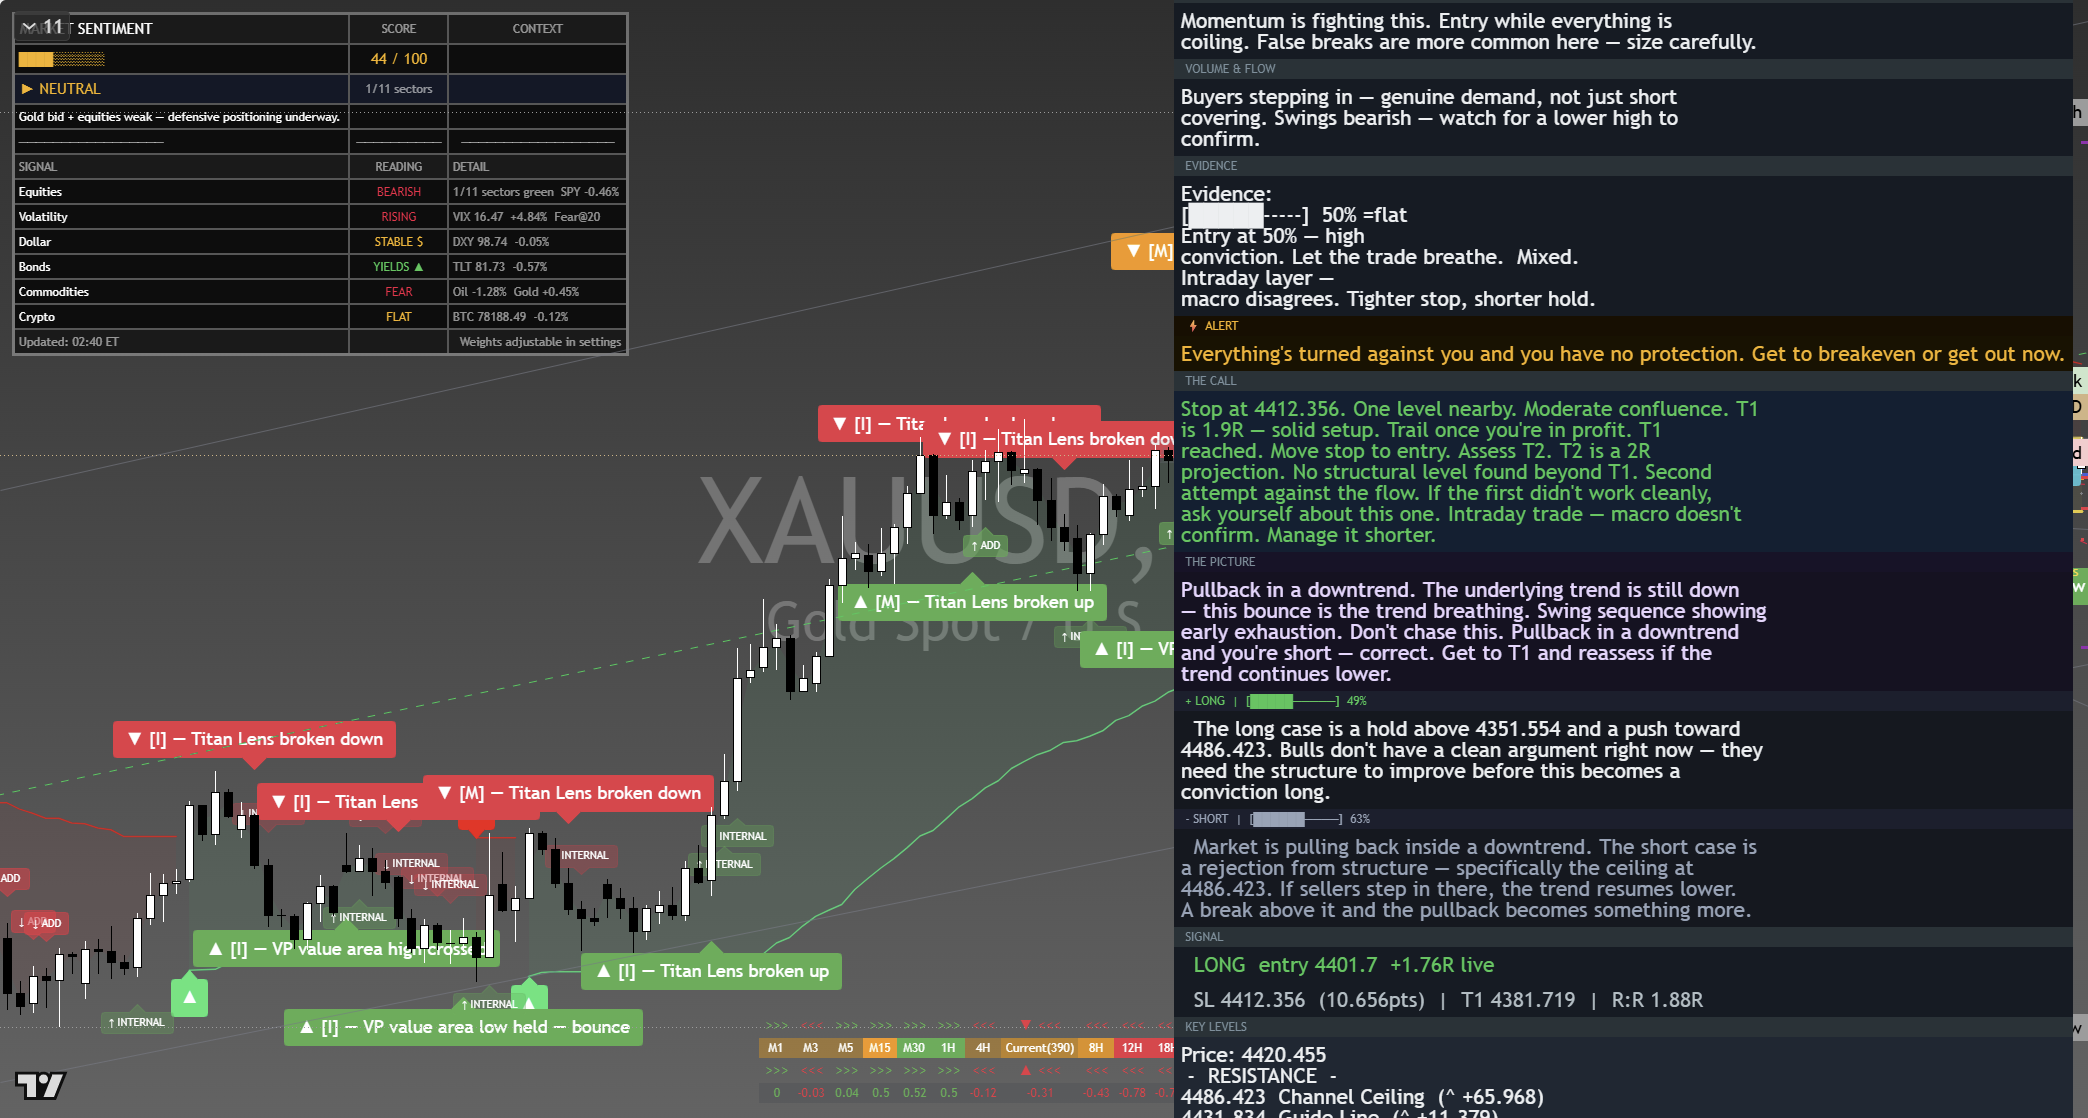
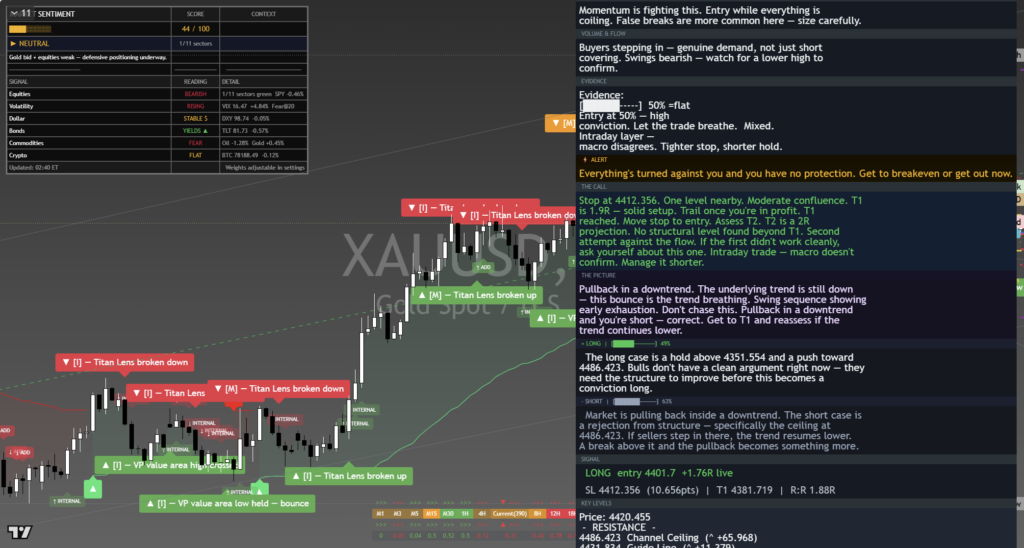
The chart above is the full daily read: structure, momentum, the levels that matter, and where the current price sits against them. Read it top to bottom for the complete picture, and pair it with our session briefs for the wider market context.
This is analysis, not financial advice. It reflects our multi-factor framework and is not a recommendation to buy or sell. Always do your own research and manage your risk.