FTSE 100 (UKX) – Daily Read
3 October 2026 | Index | Titan Macro Desk
10,462.0
The FTSE 100 is attempting to stabilise, but the balance of evidence still favours caution. Last price 10,462, 0.3 percent higher on the day. That gain matters because it shows buyers responding near an important demand zone, yet it is down near the floor of its one-month range. The clear view is that this is a defensive bounce within a weakening structure, not yet a durable turn. Buyers have room to recover ground, but they must prove that demand can survive above nearby resistance before the market deserves a more constructive reading.
The macro backdrop matters through sterling, global growth expectations, interest-rate pricing, and commodity sentiment. The index has substantial exposure to overseas revenues, energy, mining, financials, and defensive multinationals, so it can respond differently from the domestic UK economy. A firmer pound can weigh on translated overseas earnings, while better global demand and resilient commodity pricing can support heavyweight constituents. The immediate pressure is visible in the market’s own behaviour: momentum roughly 2.6 percent down over the last two weeks. One month average 10,665; price is below it, and the structure reads as a downtrend, price under both its one-month and longer averages. Until that relationship changes, rallies are vulnerable to selling from investors reducing exposure into strength.
The first test is the nearer round number handle at 10,500. Holding above it would suggest that the latest gain is attracting follow-through rather than merely short covering. Above there, the one month average 10,665 is the area where buyers would begin challenging the prevailing direction. The month swing high 10,868, about 3.9 percent above the current price, is the more important ceiling because it marks the point from which supply previously overwhelmed demand. A decisive move above 10,868 opens the path toward 10,990. That upper target also completes the three month range 10,391 to 10,990, making it a natural area for profit-taking and renewed supply.
Below the market, a shelf of support at 10,391, about 0.7 percent below, is doing the immediate defensive work. It is especially important because it is also the lower boundary of the broader range. Buyers defending it preserve the case for consolidation and recovery. Losing it would confirm that the range floor has failed and that sellers retain control. The nearer round number handle at 10,250 would then become the next logical destination, with losing 10,391 exposes 10,250.
The bull path is straightforward: if 10,391 holds and price establishes itself above 10,500, then a recovery toward 10,665 becomes credible; if buying then clears 10,868 decisively, then 10,990 is in play. The bear path is equally clear: if rebounds fail beneath 10,500 and selling breaks 10,391, then the failed floor points toward 10,250.
The main risk to the cautious view is a forceful recovery that reclaims the key overhead areas and holds them through subsequent selling. Conversely, repeated failure to build on the daily gain would reinforce the existing downward structure. Net, support is close enough to permit a bounce, but conviction belongs with the sellers until the market proves otherwise above the major ceiling.
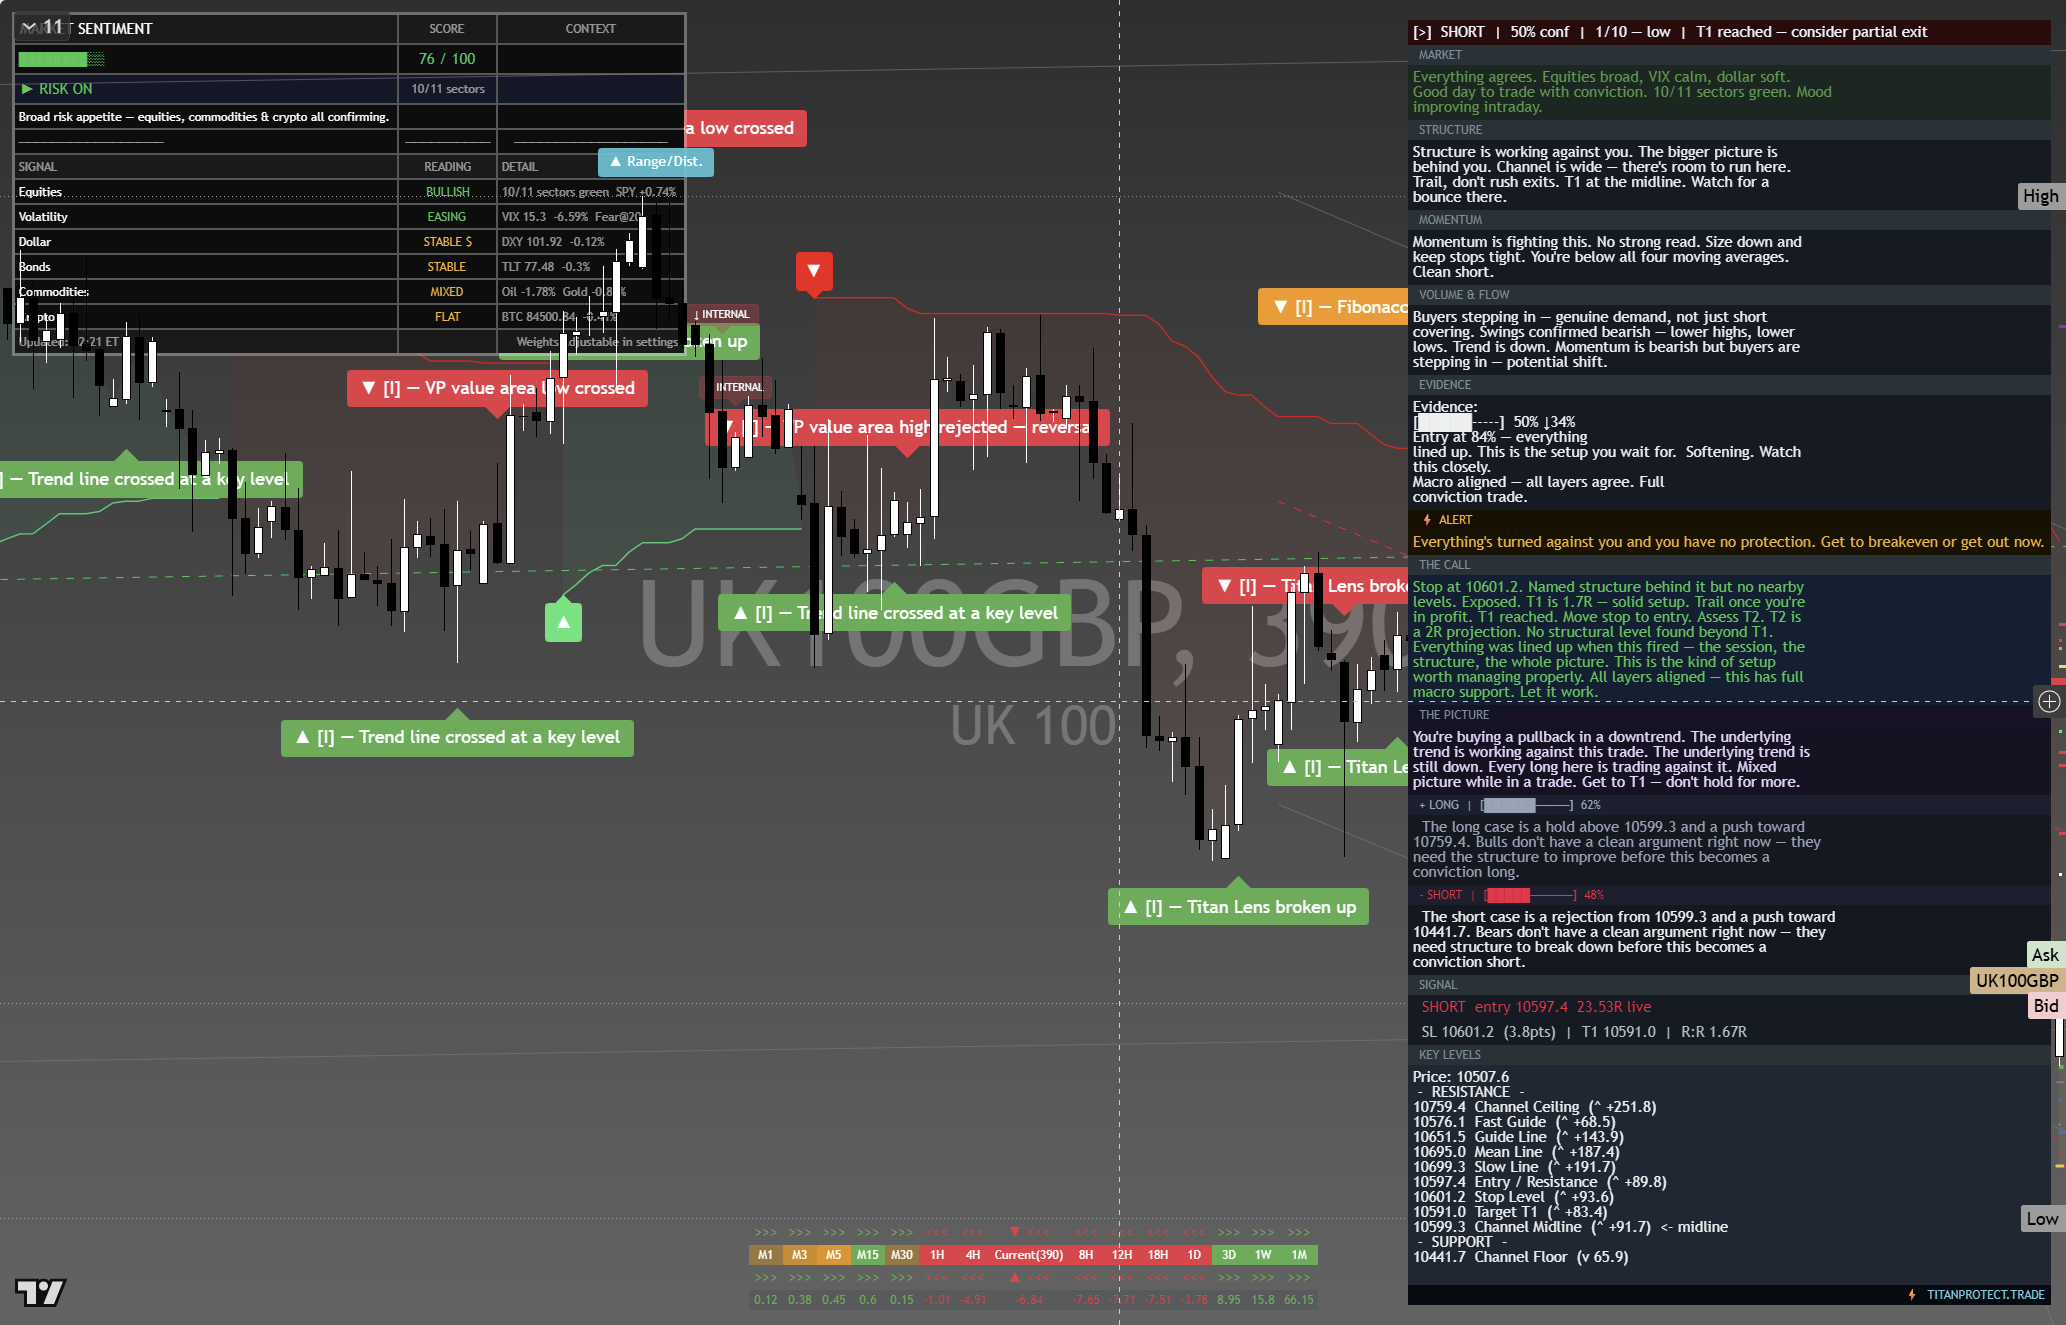
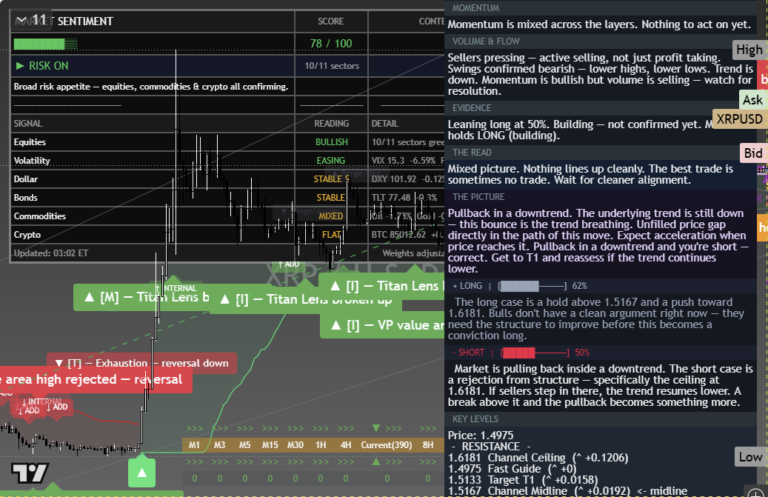
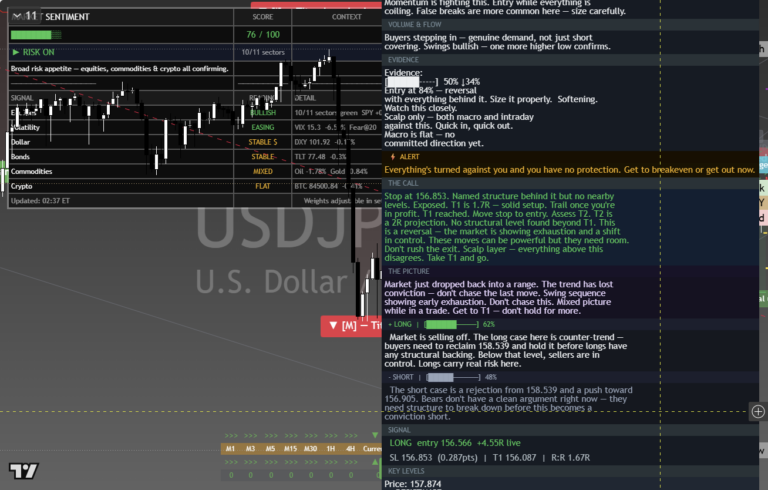
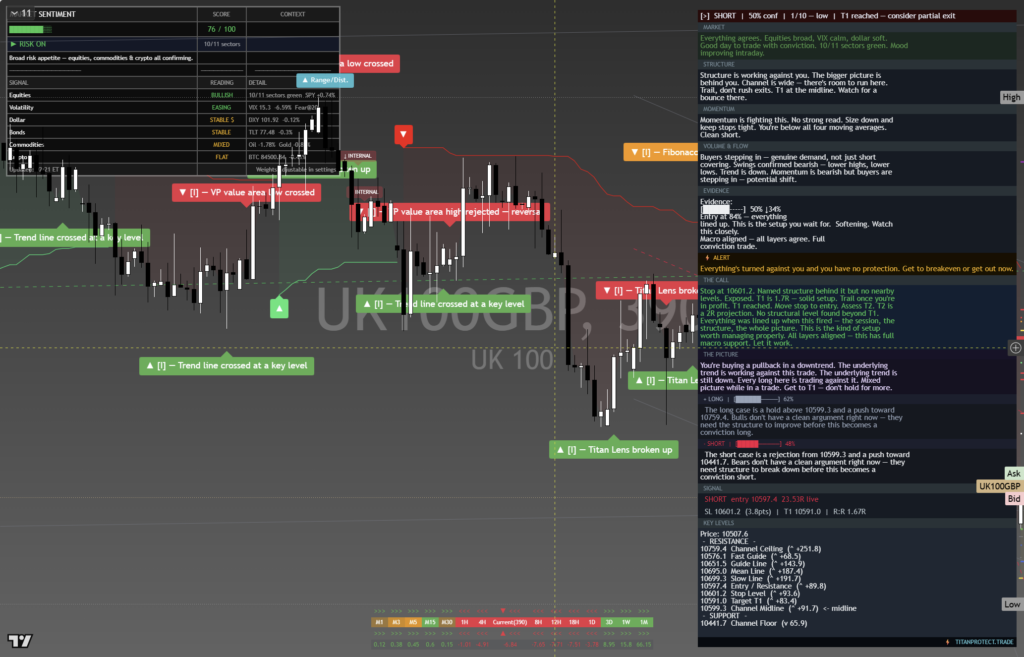
The chart above is the full daily read: structure, momentum, the levels that matter, and where the current price sits against them. Read it top to bottom for the complete picture, and pair it with our session briefs for the wider market context.
This is analysis, not financial advice. It reflects our multi-factor framework and is not a recommendation to buy or sell. Always do your own research and manage your risk.