FTSE 100 (UKX) – Daily Read
30 September 2026 | Index | Titan Macro Desk
10,636.7
The FTSE 100 is testing the lower edge of its recent structure, and the immediate bias remains cautiously bearish until buyers prove they can reclaim lost ground. Last price 10,637, 0.0 percent lower on the day. That unchanged surface masks a softer underlying picture: it is down near the floor of its one-month range, participation lacks urgency, and sellers still have positional control. The importance is straightforward. The index is close enough to support for a rebound to develop, but it has not yet produced the price action needed to call a durable low.
The macro backdrop is one in which investors must balance growth expectations, policy uncertainty, currency sensitivity, and the earnings resilience of large UK companies without relying on a single broad narrative. For this instrument, overseas revenue exposure can provide insulation when sterling is soft, while heavyweight energy, mining, financial, and defensive shares can pull the index in different directions. The one month average 10,686 sits above the market, confirming that recent value has migrated lower. The structure reads as a downtrend, with price under both its one-month and longer averages. Momentum roughly 0.2 percent down over the last two weeks reinforces the message: pressure is controlled rather than disorderly, but buyers have not regained initiative.
The first meaningful defence is the shelf of support at 10,586, about 0.5 percent below. It matters because buyers have little room to absorb another selling wave before the range weakens materially. Holding that shelf would suggest supply is being absorbed and could bring the nearer round number handle at 10,750 back into play. That handle is the first practical test of whether a bounce has substance rather than being short covering. The month swing high 10,868, about 2.2 percent above the current price, is the more important ceiling because clearing it would overturn the immediate sequence of weakness. Above there, the upper boundary of the three month range 10,398 to 10,990 becomes relevant. On the downside, the nearer round number handle at 10,500 is a psychological waypoint, but it is not a substitute for established support.
The bull path is clear: if 10,586 continues to hold, then recovery through 10,686 and acceptance above 10,750 would show that demand is rebuilding. If that improvement produces a decisive move above 10,868, it opens the path toward 10,990. The bear path is equally direct: if rebounds fail below 10,686 and selling returns, then repeated pressure on 10,586 would weaken its defence. Losing 10,586 exposes 10,398, with 10,500 likely serving only as an interim battleground.
The main risk to the bearish lean is a sharp rotation into the index’s defensive and internationally exposed heavyweights, especially if that shift carries price through the overhead barriers. A sustained recovery above 10,868 would invalidate the near-term downtrend thesis. Conversely, a brief dip below support that quickly reverses would warn against chasing weakness. Net, the FTSE 100 remains vulnerable while below 10,686, but proximity to 10,586 makes this a decision zone rather than an attractive place for complacent bearishness.
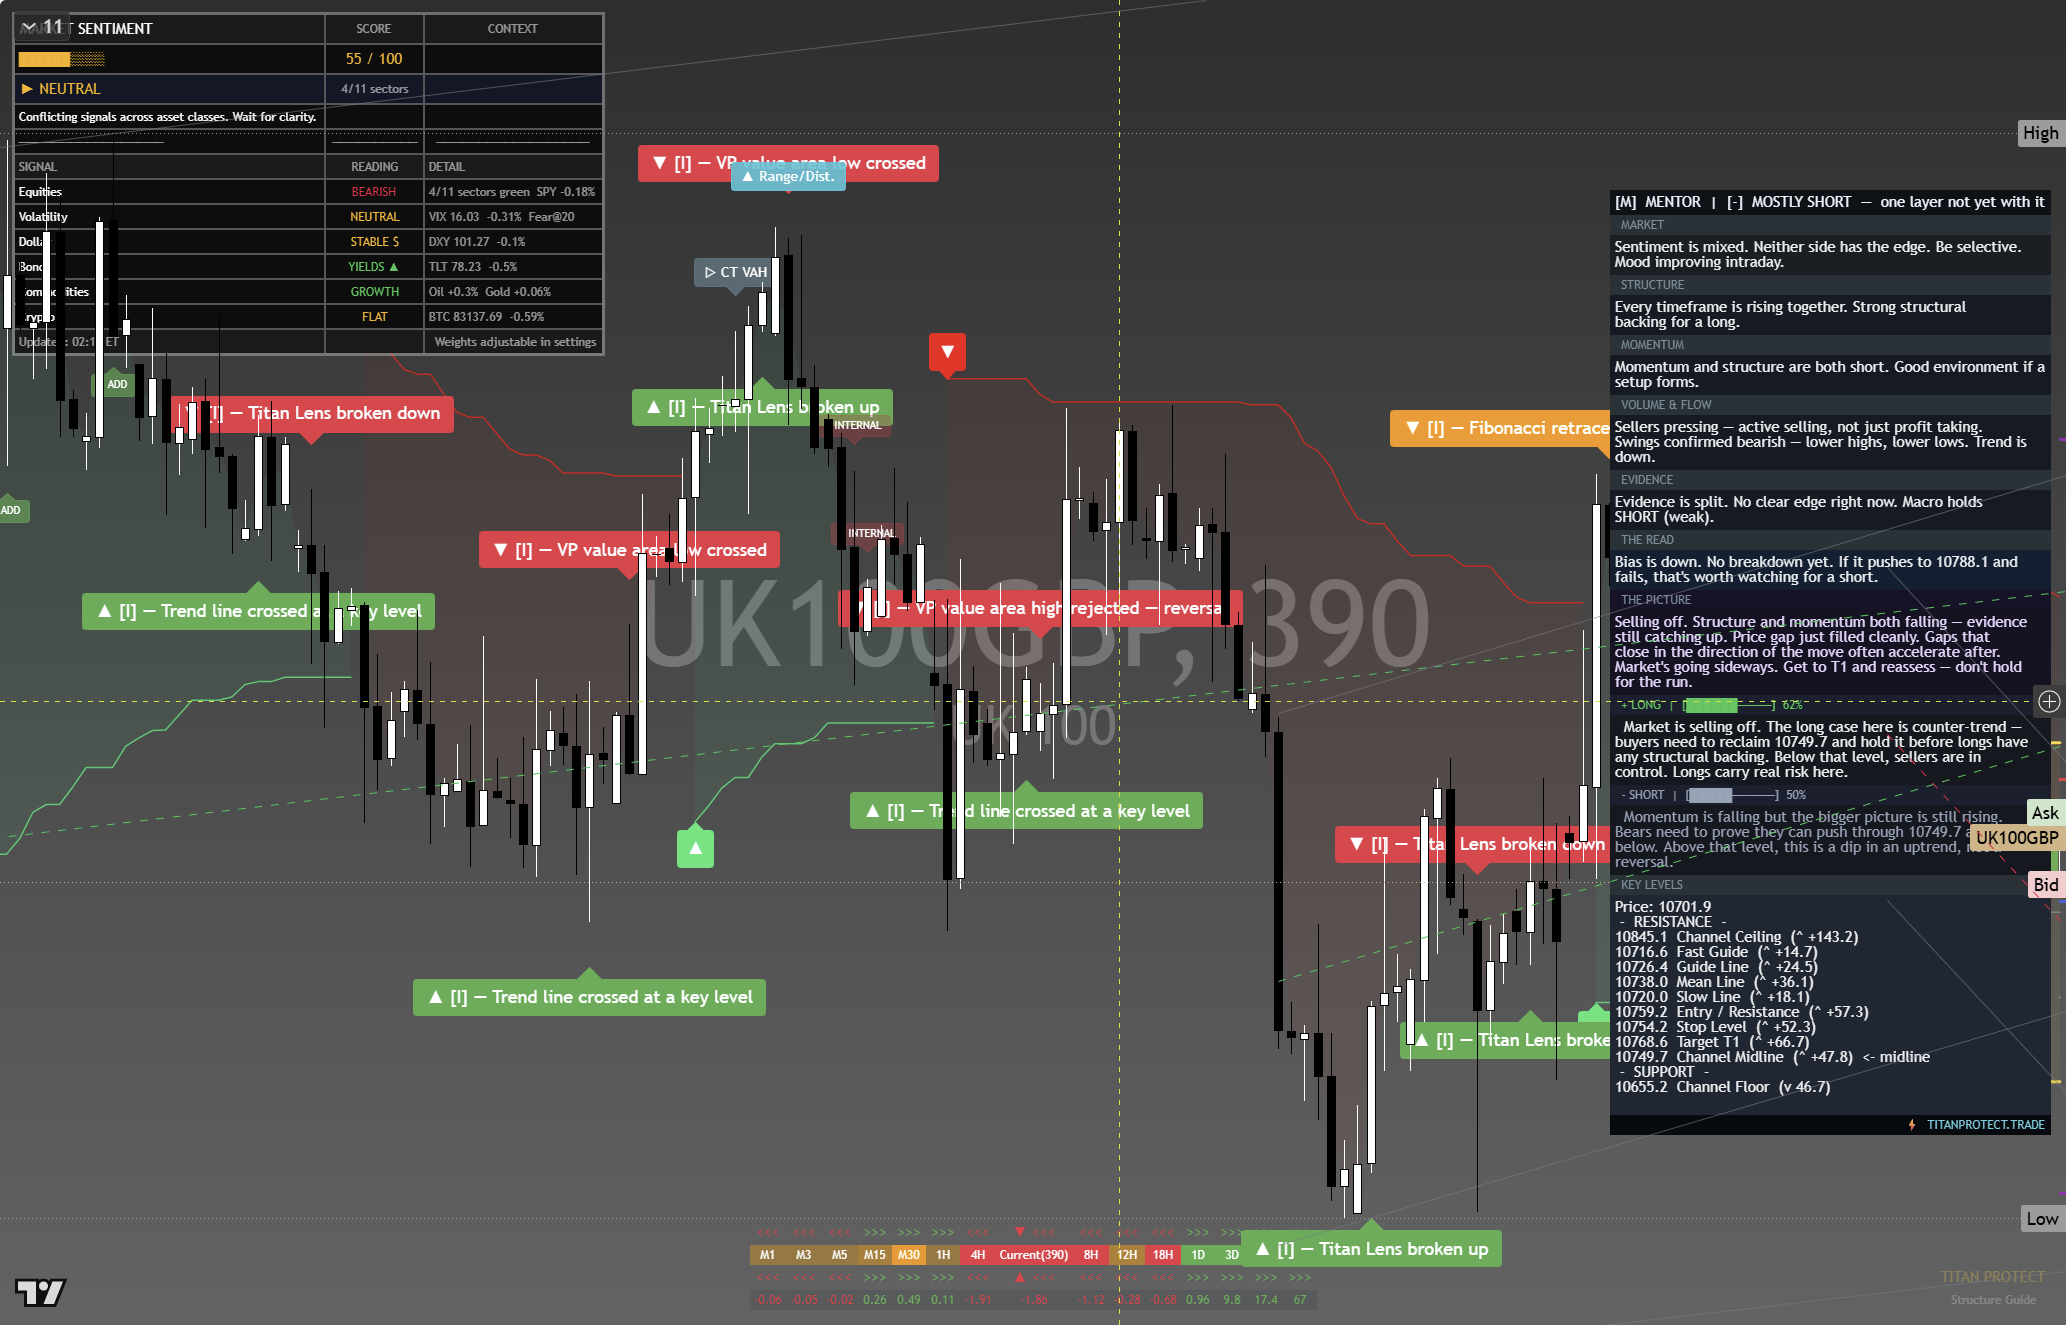
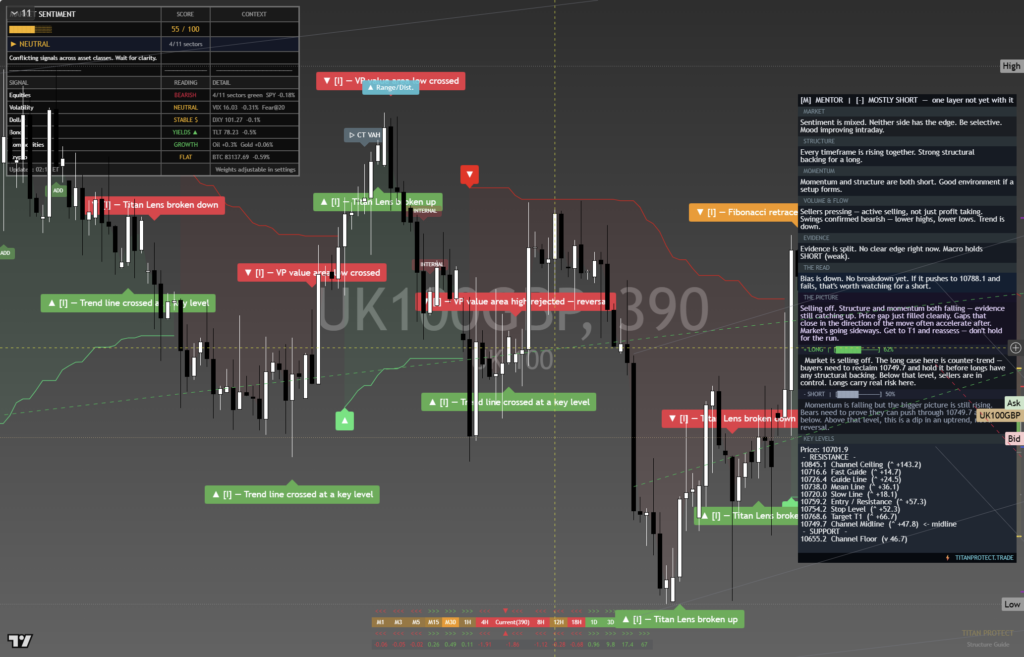
The chart above is the full daily read: structure, momentum, the levels that matter, and where the current price sits against them. Read it top to bottom for the complete picture, and pair it with our session briefs for the wider market context.
This is analysis, not financial advice. It reflects our multi-factor framework and is not a recommendation to buy or sell. Always do your own research and manage your risk.