FTSE 100 (UKX) – Daily Read
15 September 2026 | Index | Titan Macro Desk
10,650.4
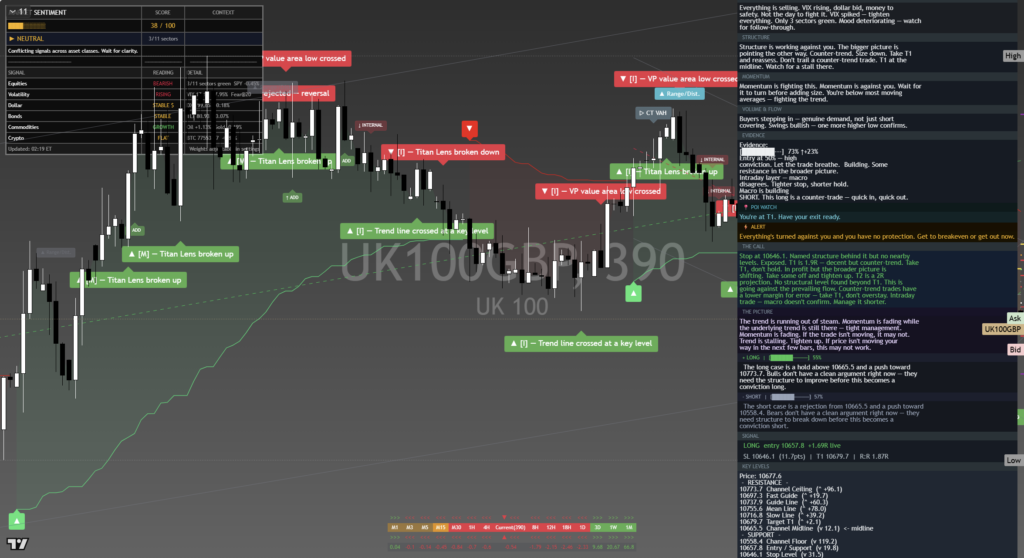
The FTSE 100 is losing altitude as inflation anxiety, elevated energy costs and central-bank uncertainty outweigh the support available from defensive companies and large overseas earners. Last price is 10,650, 0.5 percent lower on the day, leaving the index down near the floor of its one-month range. The clear view is that sellers retain control while price remains below the recent balance area. That matters because weakness is no longer confined to an isolated session. It is developing close to support, where the next response should reveal whether investors still want to buy weakness or are preparing for a deeper reset.
The macro backdrop is uncomfortable for UK equities. Energy supply concerns can lift heavyweight oil producers, but they also reinforce inflation pressure, push against easier monetary policy and challenge consumer-facing and rate-sensitive companies. Central-bank decisions in the UK and US add event risk, while movements in sterling can quickly change the relative appeal of the FTSE’s internationally exposed earnings. This creates a divided index: energy and defensive shares can provide ballast, but they may not be enough if higher yields, weaker risk appetite and pressure on miners broaden the selling.
The one month average is 10,763; price is below it, and the structure reads as a downtrend, price under both its one-month and longer averages. Momentum is roughly 1.7 percent down over the last two weeks, confirming that rebounds have not yet repaired the damage. The nearer 10,750 round number handle matters because reclaiming it would begin to relieve immediate pressure and put price back near the recent balance point. Until then, rallies risk attracting supply.
A shelf of support sits at 10,594, about 0.5 percent below. Buyers must defend it because it separates an orderly pullback from a potentially broader range retracement. The 10,500 round number handle would then become an important psychological test, where bargain demand could appear but where failure would underline deteriorating confidence. The three month range is 10,252 to 10,990, so the lower boundary is the larger structural reference if nearby support gives way. Above, the month swing high is 10,920, about 2.5 percent above the current price. It represents the point where sellers previously imposed control and therefore the level bulls must clear to establish more than a relief rally.
If buyers defend 10,594, recover 10,750 and then sustain trade above 10,763, the market can rebuild toward 10,920. A decisive move above 10,920 opens the path toward 10,990, with the range ceiling becoming the natural test of whether the correction has fully reversed. If 10,594 fails, however, selling can press toward 10,500. Losing that handle would strengthen the bearish message, and losing 10,594 exposes 10,252.
The main risk to the bearish read is a broad improvement in risk appetite, helped by calmer energy markets, softer yield pressure or supportive sterling dynamics. Its invalidation requires price to reclaim and hold above 10,920. Conversely, failure to generate a convincing response at 10,594 would invalidate the idea that this remains a contained pullback. Net, the FTSE 100 is vulnerable but approaching a meaningful decision point: respect support and a repair phase is credible; lose it and the wider range floor becomes the market’s focus.
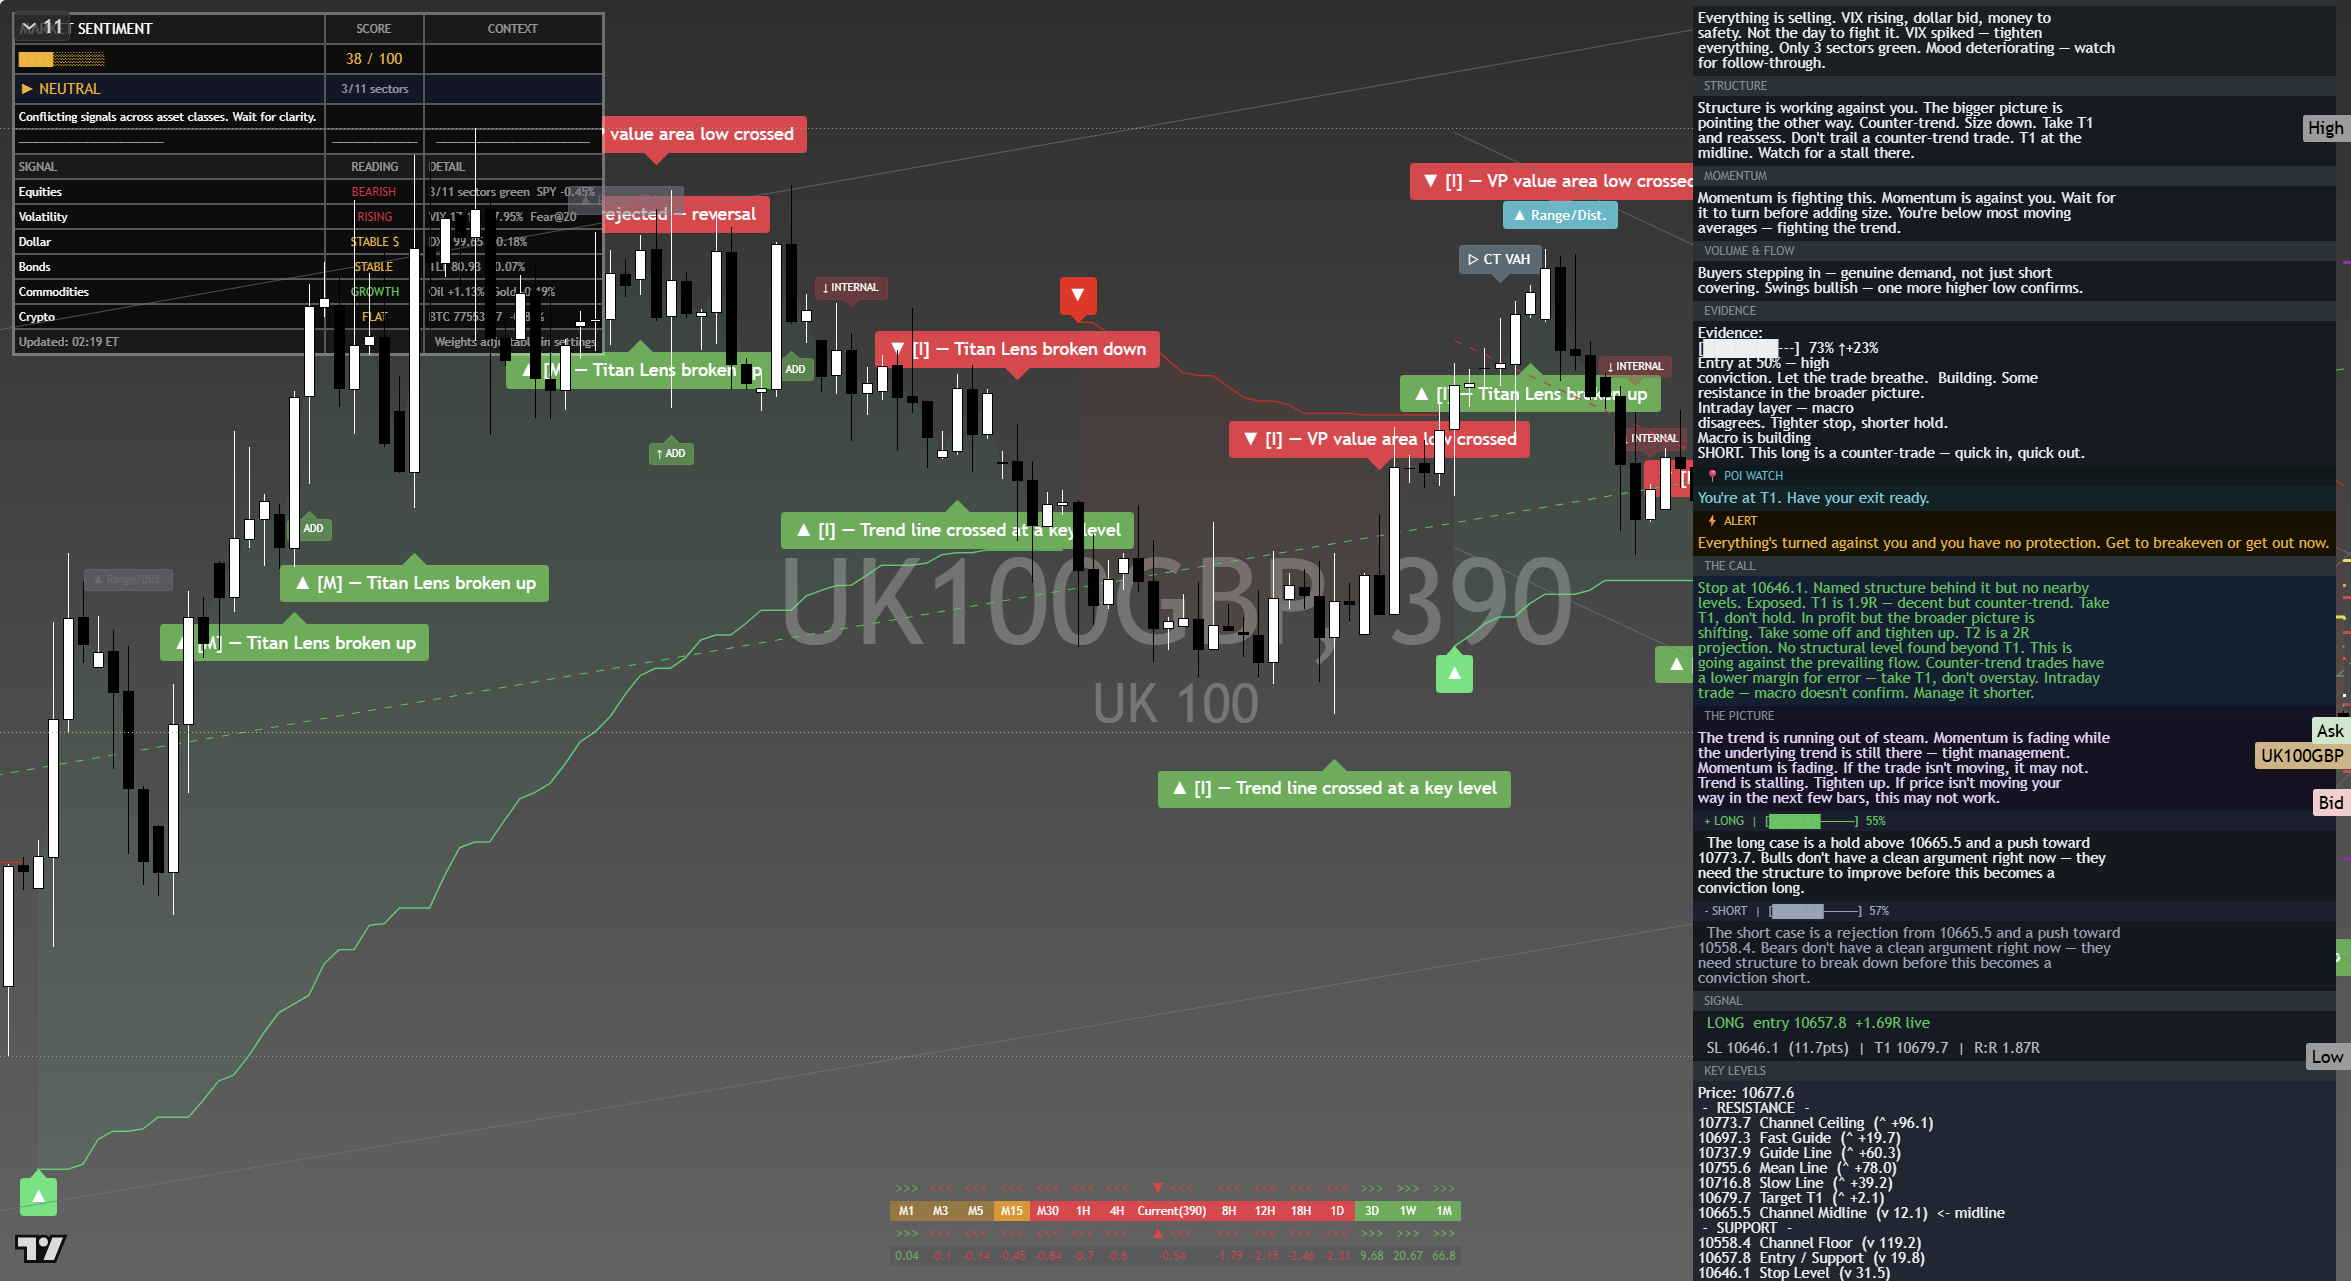
The chart above is the full daily read: structure, momentum, the levels that matter, and where the current price sits against them. Read it top to bottom for the complete picture, and pair it with our session briefs for the wider market context.
This is analysis, not financial advice. It reflects our multi-factor framework and is not a recommendation to buy or sell. Always do your own research and manage your risk.