EUR/USD – Daily Read
21 September 2026 | Forex | Titan Macro Desk
1.1482
EUR/USD enters 21 September 2026 on the defensive, but the broader advance has not yet been broken. Last price is 1.1482, 0.1 percent lower on the day, leaving the pair down near the floor of its one-month range. The clear view is that this remains a pullback within a longer upward trend, although sellers currently control the short-term tape. That distinction matters because nearby support can still attract demand, while failure there would turn an orderly retreat into a more meaningful deterioration.
The macro backdrop is a contest between relative rate expectations, confidence in the European outlook, and demand for the dollar when investors become cautious. EUR/USD is particularly sensitive to shifts in the expected policy gap between the Federal Reserve and the European Central Bank. A firmer dollar can keep pressure on the pair even without a decisive change in the longer trend, while improved risk appetite or greater confidence in European growth can revive euro demand. For now, momentum is roughly 1.1 percent down over the last two weeks. The one month average is 1.1573; price is below it, and the structure reads as a pullback, slipping under the one-month average while the longer trend still points up. Buyers therefore need to reclaim lost ground before the market can credibly argue that the correction has run its course.
The first defensive line is the shelf of support at 1.1459, about 0.2 percent below. It matters because the market is already trading near the lower boundary of its recent range, so buyers defending that shelf would show that underlying demand remains active despite recent weakness. Losing 1.1459 exposes 1.1357, the bottom of the three month range of 1.1357 to 1.1715. The nearer round number handles at 1.1600 and 1.1400 frame the immediate contest. A recovery through 1.1600 would signal that buyers are rebuilding control, while a slide through 1.1400 would reinforce the message from broken support and make the lower range boundary the natural focus.
On the bull path, if 1.1459 holds and price regains 1.1573, then the pullback begins to look contained rather than structural. If buying subsequently clears 1.1600, attention turns to the month swing high at 1.1663, about 1.6 percent above the current price. A decisive move above 1.1663 opens the path toward 1.1715, confirming that the longer upward trend has regained authority.
On the bear path, if rallies fail beneath 1.1573 and sellers force a clean loss of 1.1459, then the recent weakness is no longer merely consolidation. Losing 1.1459 exposes 1.1357, with 1.1400 offering a possible pause but not a convincing defence by itself.
The principal risk to the bearish near-term view is a sustained recovery through 1.1573 and 1.1600. The principal invalidation of the broader constructive view is failure at 1.1459 followed by acceptance below 1.1400. Net, EUR/USD is vulnerable in the short run, but the larger bullish structure survives while the key support shelf holds.
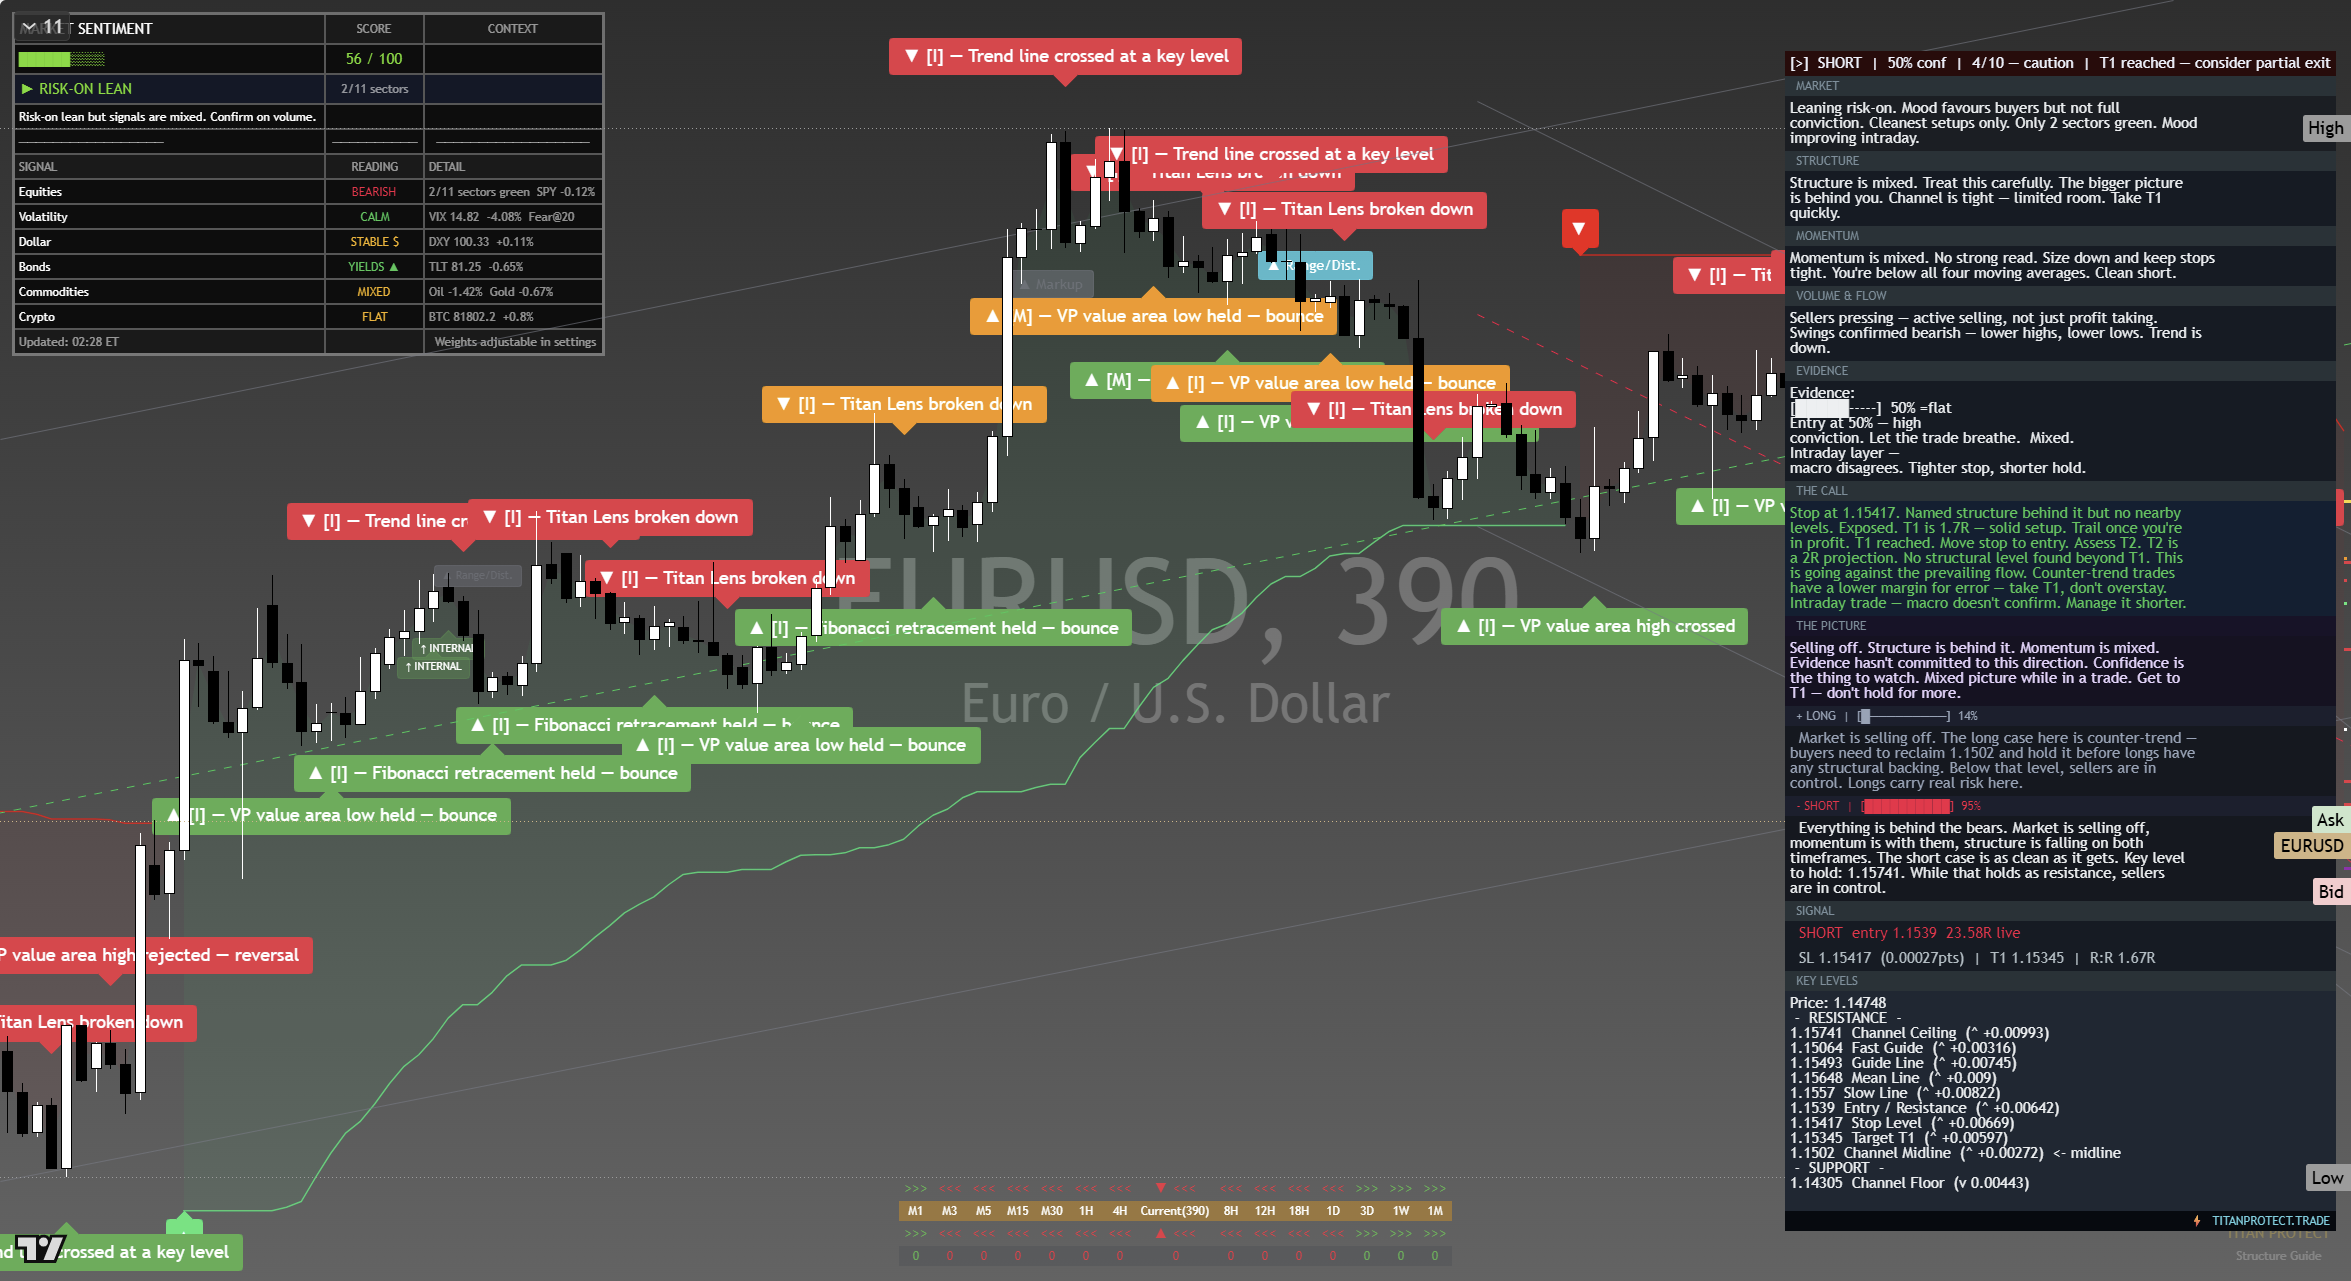
The chart above is the full daily read: structure, momentum, the levels that matter, and where the current price sits against them. Read it top to bottom for the complete picture, and pair it with our session briefs for the wider market context.
This is analysis, not financial advice. It reflects our multi-factor framework and is not a recommendation to buy or sell. Always do your own research and manage your risk.