Ethereum (ETH) – Daily Read
21 September 2026 | Crypto | Titan Macro Desk
$2,641.59
Ethereum is testing the edge of a meaningful breakout, with the last price at $2,642, 0.9 percent higher on the day, as buyers press the top of its one-month range. The clear view is constructive but disciplined: demand remains in control, yet price is now close enough to resistance that continuation must be confirmed rather than assumed. This matters because acceptance beyond the range ceiling would turn a strong advance into a fresh expansion, while rejection would expose how much optimism is already embedded near the highs.
The broader crypto backdrop is favoring assets that can demonstrate persistent demand, and Ethereum is doing that through both trend and relative price behavior. Its one month average is $2,495; price is above it, and the structure reads as a clean uptrend, price above both its one-month and longer averages. Momentum is roughly 7.3 percent up over the last two weeks, showing that this test of resistance has arrived with sustained buying rather than a single abrupt squeeze. The instrument-specific catalyst is therefore the price action itself: Ethereum is challenging the upper boundary of a broad recovery and asking whether buyers can absorb supply where previous advances have stalled.
The immediate decision point is the month swing high at $2,645, about 0.1 percent above the current price. That level matters because it marks the visible cap of the current range and the upper end of the three month range at $1,521 to $2,645. Sellers defending it can argue that the advance remains contained, but a decisive move above $2,645 opens the path toward $2,650. That nearer round number handle is important as the first test of whether a breakout can attract follow-through rather than fail immediately.
On the downside, $2,600 is the nearer round number handle that should help distinguish a routine pause from a loss of short-term control. Holding above it would keep pressure focused on the highs. Slipping below it would not by itself reverse the broader structure, but it would signal that buyers near the range ceiling have lost urgency. The one month average at $2,495 then becomes an important structural reference because sustained trade beneath it would weaken the clean uptrend. Deeper down, a shelf of support at $2,359, about 10.7 percent below, is the key defense. It represents the level where buyers must reassert control to preserve the broader recovery. Losing $2,359 exposes $1,521, making that break materially more serious than ordinary volatility.
The bull path is straightforward: if Ethereum clears $2,645 decisively and holds the breakout, then $2,650 becomes the next proving ground, with continued acceptance supporting a broader range expansion. The bear path begins with rejection at the high: if price loses $2,600 and cannot reclaim it, then attention shifts toward $2,495; if that support also fails, pressure can build toward $2,359.
The main risk is a false breakout that briefly clears resistance but cannot hold it. The read is invalidated by a loss of $2,359, because that would replace orderly trend support with a much wider downside range. Net, Ethereum remains bullish while above its core supports, but conviction now depends on clean acceptance beyond the range high.
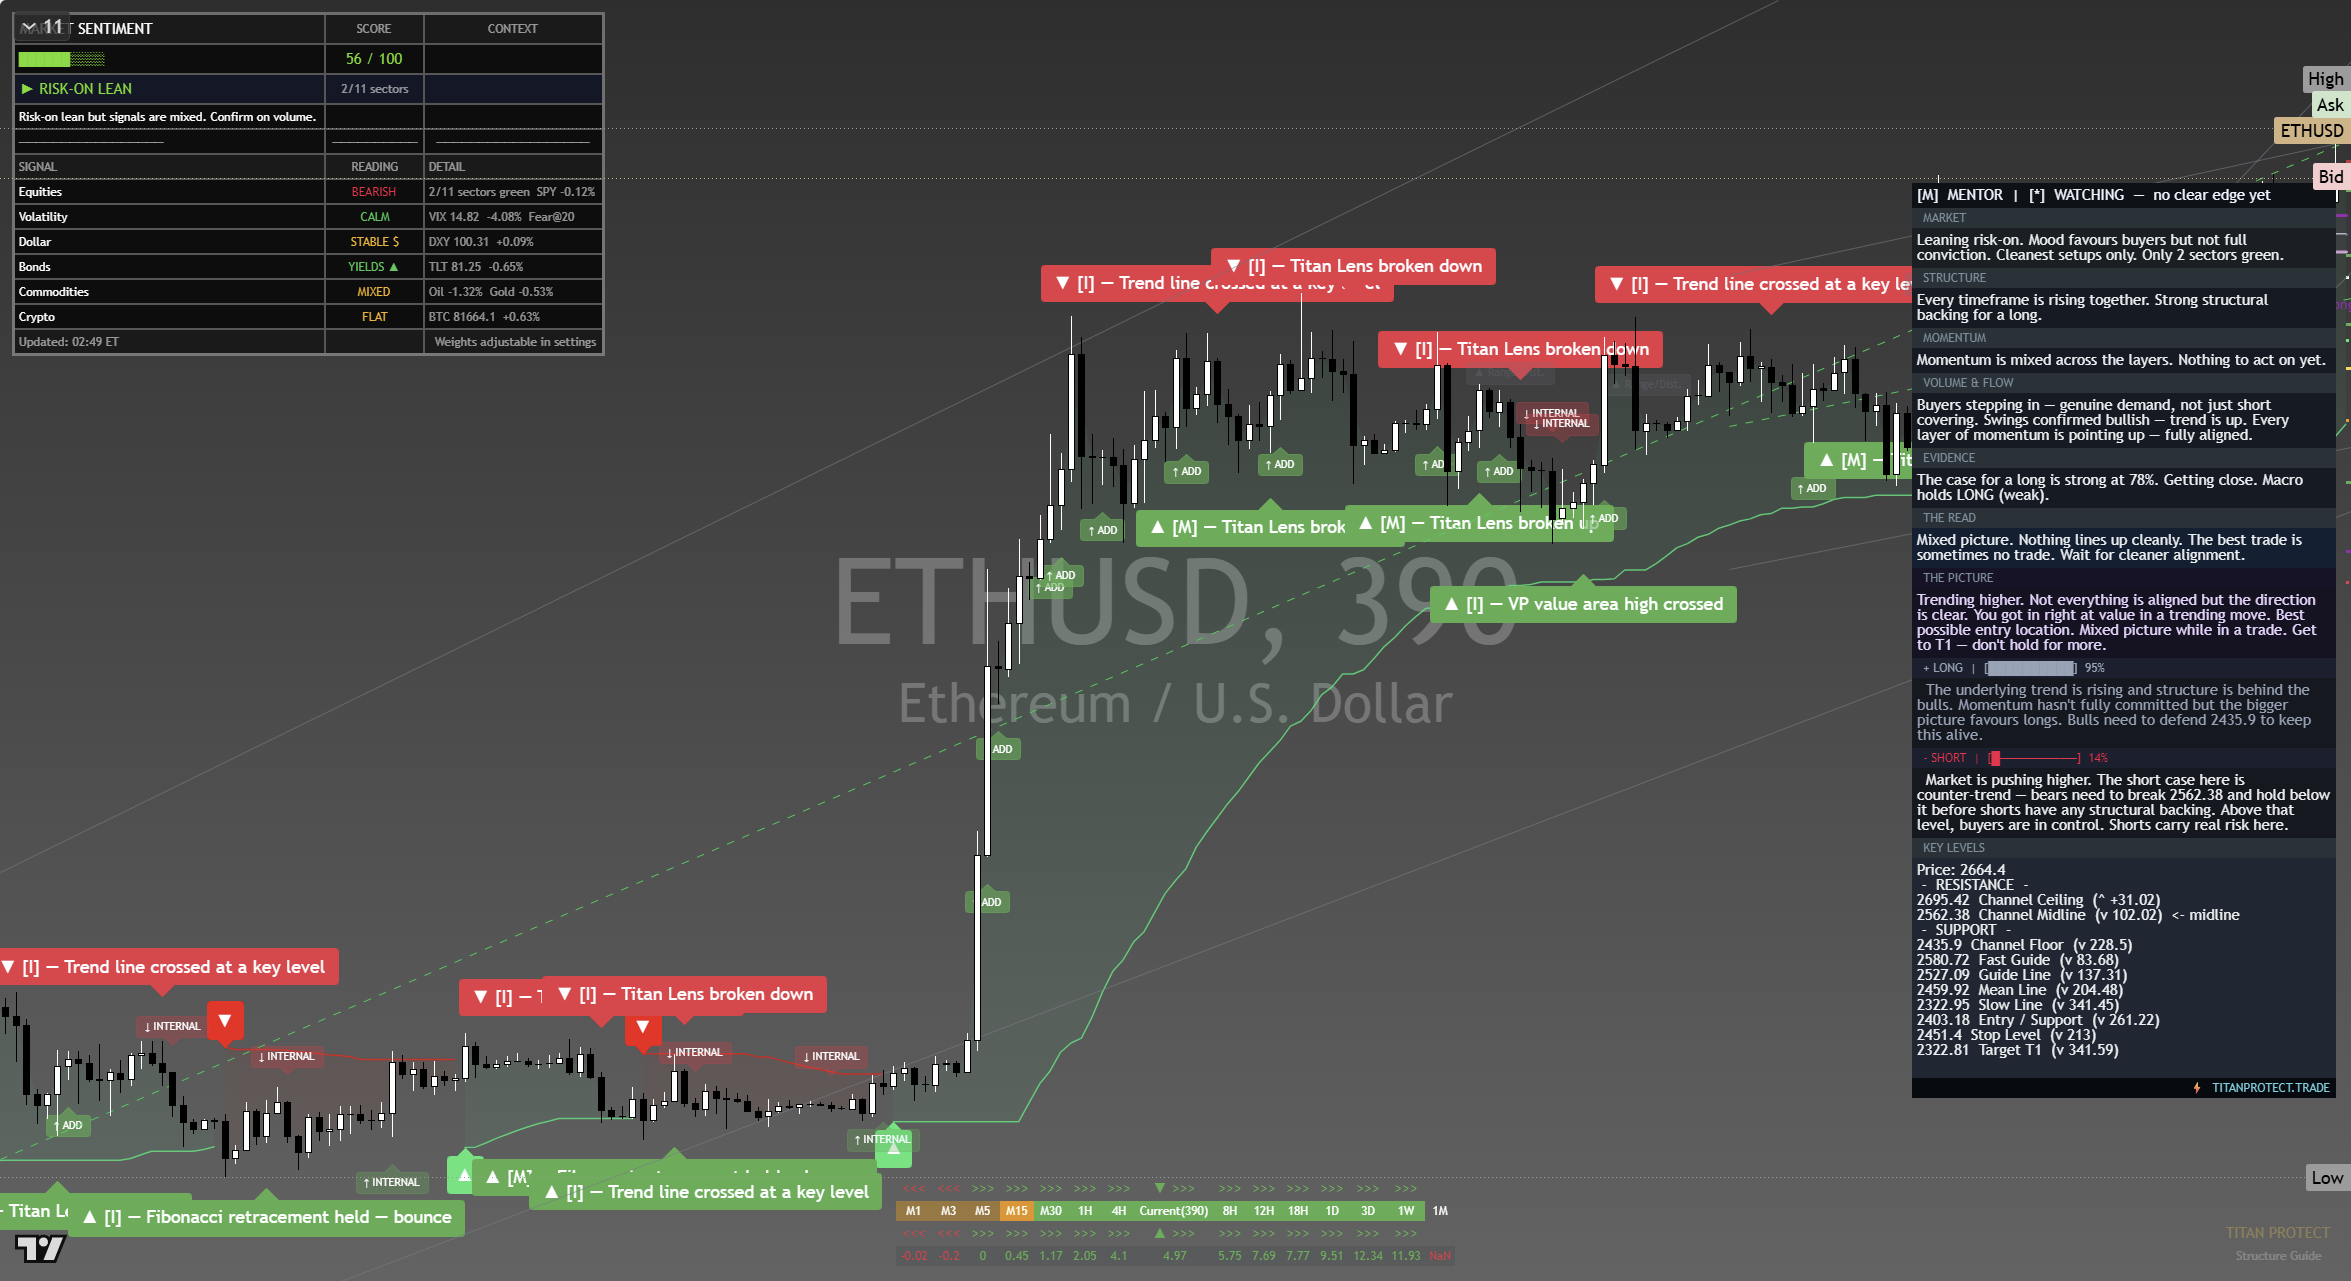
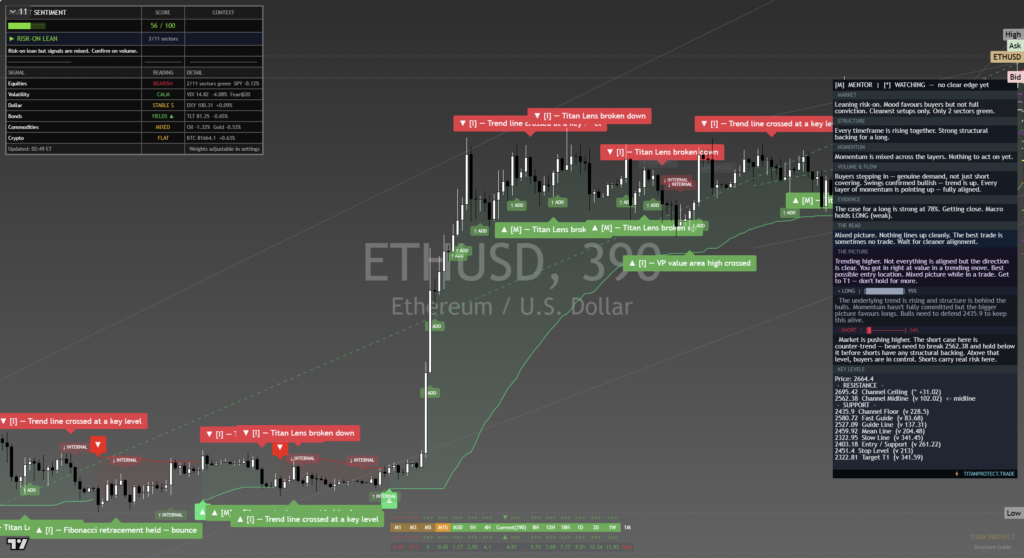
The chart above is the full daily read: structure, momentum, the levels that matter, and where the current price sits against them. Read it top to bottom for the complete picture, and pair it with our session briefs for the wider market context.
This is analysis, not financial advice. It reflects our multi-factor framework and is not a recommendation to buy or sell. Always do your own research and manage your risk.