Ethereum (ETH) – Daily Read
17 September 2026 | Crypto | Titan Macro Desk
$2,416.34
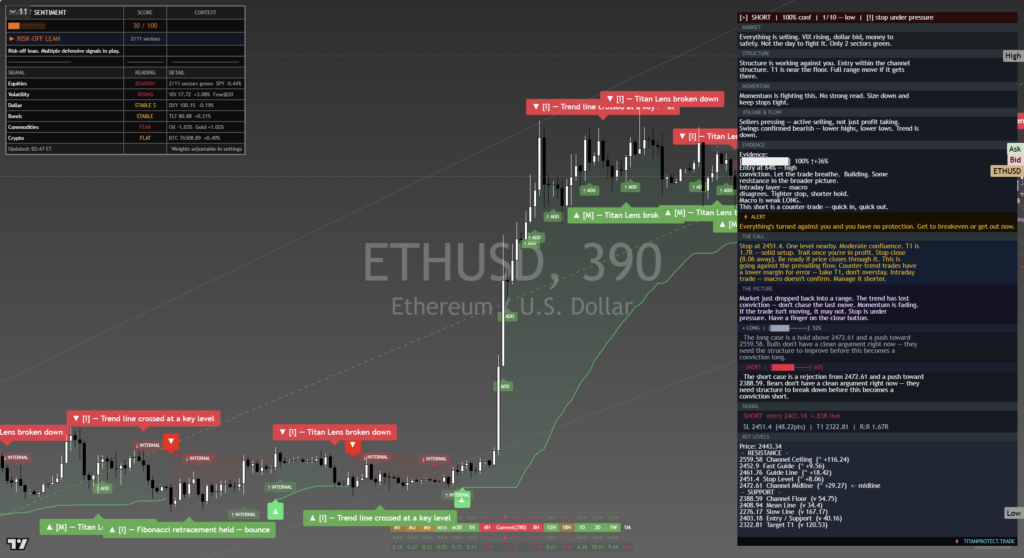
Ethereum is attempting to steady, but the balance of evidence still describes a corrective phase rather than a clean return to strength. Last price is $2,416, 0.4 percent higher on the day, yet it is trading in the lower half of its one-month range. That matters because the longer trend still points up, while near-term price action shows sellers retaining control of the recovery. The clear view is cautiously constructive above support, but conviction should remain limited until ETH reclaims the ground that would turn stabilization into renewed demand.
The broader crypto backdrop remains sensitive to global liquidity expectations, risk appetite, and changes in demand for higher-volatility assets. ETH also has its own relative challenge: buyers must demonstrate that capital is returning to the asset rather than merely supporting the wider market. The one month average is $2,473; price is below it, and the structure reads as a pullback, slipping under the one-month average while the longer trend still points up. Momentum is roughly 3.2 percent down over the last two weeks, confirming that the recent advance has lost force even though the larger structure has not yet broken.
The immediate contest sits around the nearer round number handles at $2,450 and $2,400. The first is the nearest recovery marker, where sellers can defend the pullback by fading rebounds. The second is a psychological line that buyers need to hold to prevent routine weakness from becoming a deeper retreat. Above them, the month swing high is $2,639, about 9.2 percent above the current price. That is the decisive supply boundary because clearing it would erase the pullback structure and signal that buyers have regained control.
Below the market, a shelf of support at $2,359, about 2.4 percent below, is the key defensive area. Buyers should respond there because it is close enough to anchor the current consolidation without damaging the broader uptrend. The wider three month range is $1,521 to $2,639, which shows both how far ETH has travelled and how much downside could reopen if the upper portion of that range fails. Losing the shelf would therefore carry more weight than an ordinary intraday dip.
The bull path is straightforward: if ETH holds $2,400, reclaims $2,450, and then sustains trade above $2,473, the pullback begins to look absorbed. If buyers subsequently force a decisive move above $2,639, that opens the path toward $2,689. The bear path begins if rebounds repeatedly fail beneath $2,450 and pressure pushes price through $2,400. If that selling then breaks $2,359, the market loses its nearby base and exposes $1,521.
The main risk to the constructive view is persistent weakness across crypto combined with ETH failing to attract asset-specific demand. A loss of $2,359 invalidates the idea that this is merely a contained pullback. Conversely, the bearish read is invalidated by acceptance above $2,639. Net, ETH remains in a larger uptrend but is not yet through its correction. Support can still hold, though buyers need to reclaim nearby resistance before the upside case deserves stronger conviction.
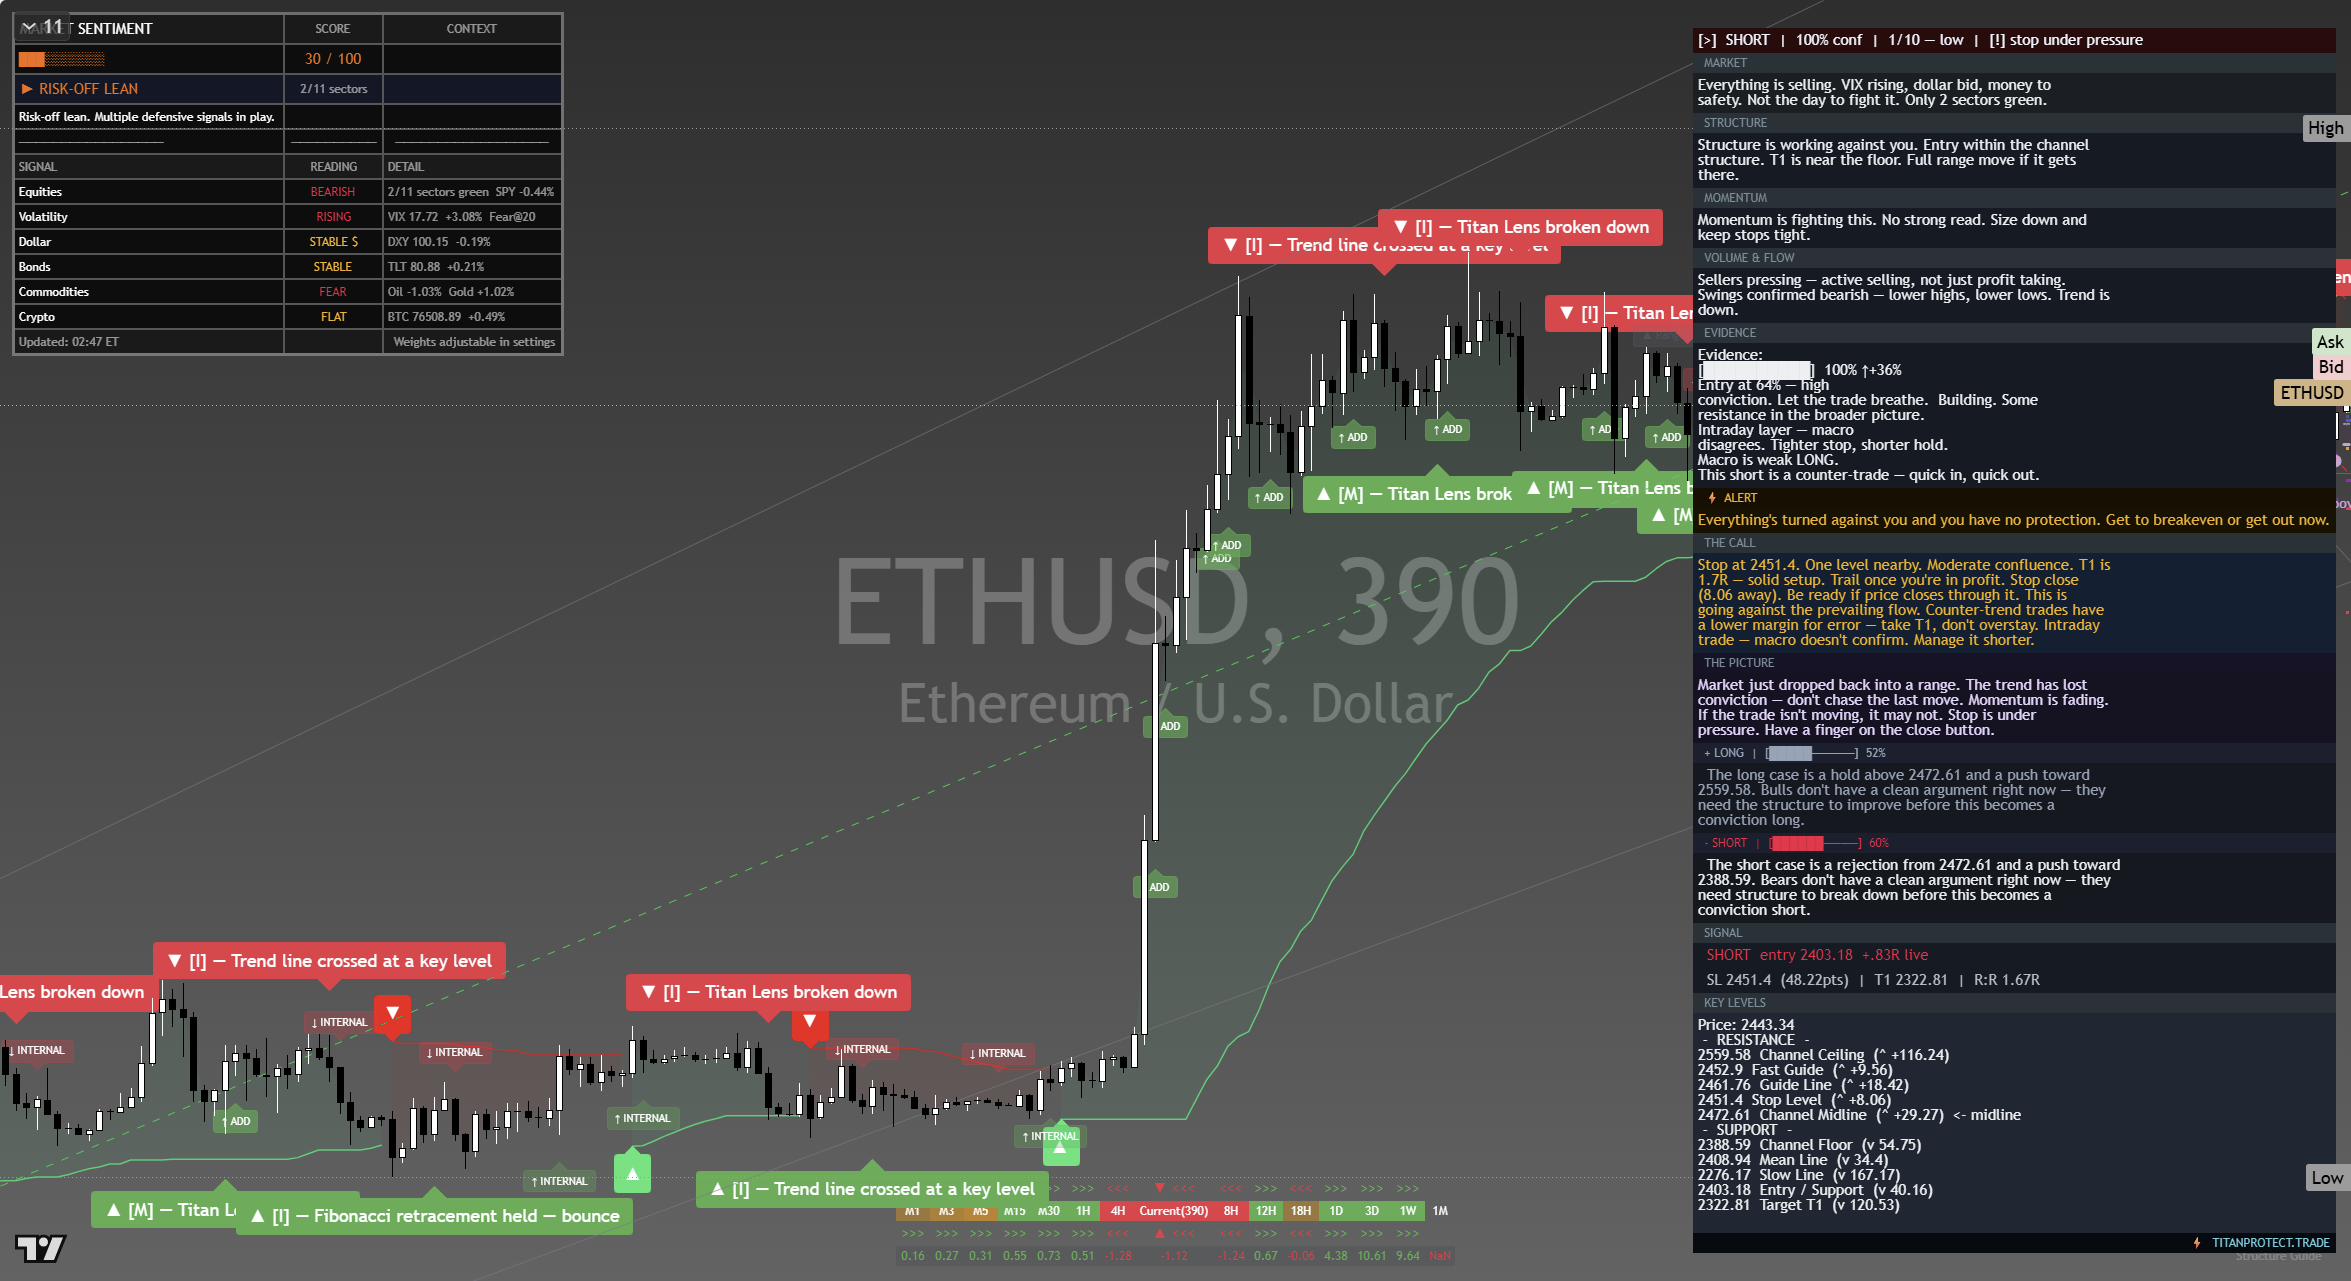
The chart above is the full daily read: structure, momentum, the levels that matter, and where the current price sits against them. Read it top to bottom for the complete picture, and pair it with our session briefs for the wider market context.
This is analysis, not financial advice. It reflects our multi-factor framework and is not a recommendation to buy or sell. Always do your own research and manage your risk.