US Dollar Index (DXY) – Daily Read
17 September 2026 | Forex | Titan Macro Desk
$100.34
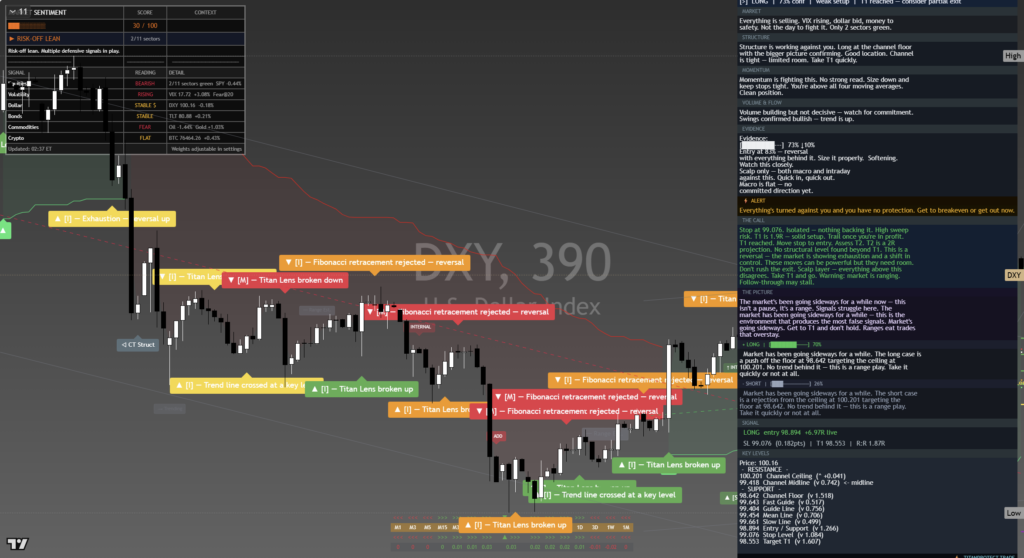
The US Dollar Index is attempting to turn recovery into a broader breakout, with the last price at 100.34, 0.0 percent higher on the day. It is pressing the top of its one-month range after rebuilding short-term structure, so the immediate question is whether buyers can convert resilience into acceptance above resistance. The view is cautiously constructive while price holds the nearby psychological pivot, but conviction requires a clean range break. That matters across Forex because a stronger dollar would tighten financial conditions and pressure currencies whose support depends on improving global risk appetite.
The macro backdrop is best understood through relative expectations. DXY should respond to shifts in anticipated US monetary policy, Treasury demand, global growth confidence, and haven flows, but the decisive input is whether those forces move more favorably for the dollar than for its major counterparts. The one month average is 99.33; price is above it, and the structure reads as a recovery attempt, back above the one-month average but still under the longer one. Momentum is roughly 1.2 percent up over the last two weeks. That combination shows improving demand without yet proving a durable trend change. Follow-through therefore matters more than the unchanged daily print.
The month swing high at 100.35, about 0.0 percent above the current price, is the immediate decision point. It matters because sellers have already defined it as the ceiling of the recent range, while buyers are now testing that supply from a position of improving structure. The nearer round number handles at 102.00 and 100.00 frame the contest. Holding 100.00 would preserve the breakout setup and suggest dips are being absorbed. The three month range is 98.56 to 101.64, making 101.64 the more meaningful upside boundary where a recovery would confront established supply. Below, a shelf of support at 98.60, about 1.7 percent below, is defended by its proximity to the lower edge of that broader range. Failure there would show that the recovery has unwound rather than merely paused.
The bull path is straightforward: if the index sustains trade above 100.00 and a decisive move above 100.35 follows, then the range ceiling has yielded and the path opens toward 101.64. If demand remains firm there, attention can shift toward 102.00, where buyers would need to prove the move is becoming a broader dollar advance rather than a temporary squeeze. The bear path begins if rejection at 100.35 pushes price back through 100.00. If that failure attracts follow-through selling, then 99.33 becomes the test of whether the recovery structure can survive. Losing 98.60 exposes 98.00 and would signal renewed downside control.
The principal risk to the constructive read is a rapid reversal in relative policy expectations or a broad improvement in global risk appetite that reduces demand for dollars. The read is invalidated by acceptance below 98.60, while repeated failure at 100.35 would weaken it before that point. Net, DXY has the posture of a recovery pressing resistance, but the advantage belongs to buyers only if they secure the breakout rather than merely touch it.
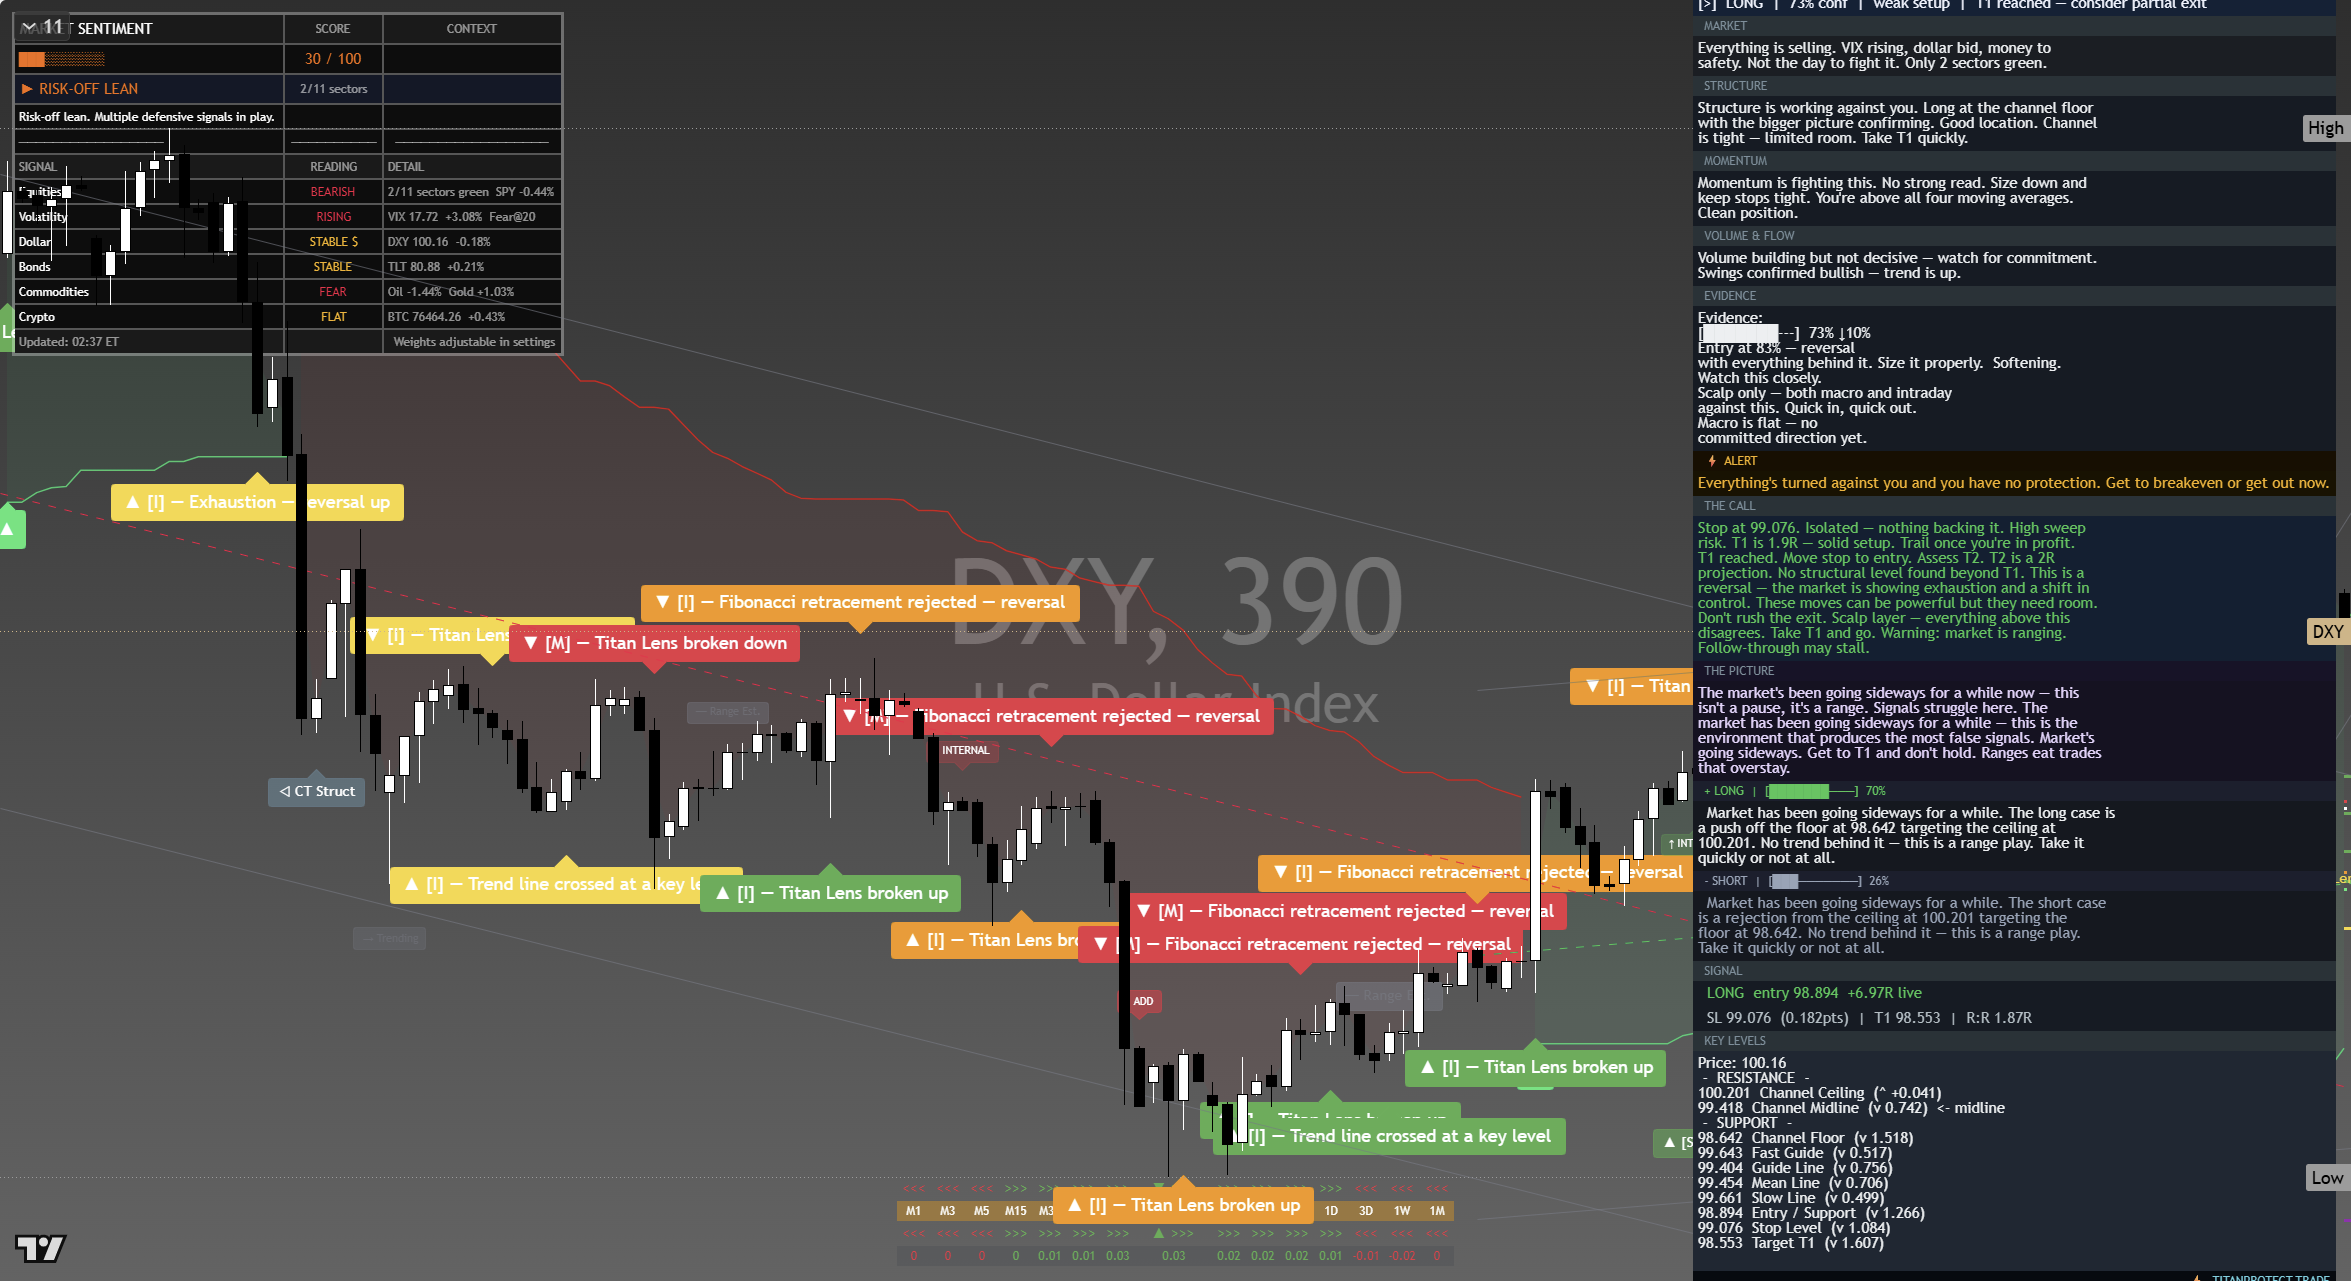
The chart above is the full daily read: structure, momentum, the levels that matter, and where the current price sits against them. Read it top to bottom for the complete picture, and pair it with our session briefs for the wider market context.
This is analysis, not financial advice. It reflects our multi-factor framework and is not a recommendation to buy or sell. Always do your own research and manage your risk.