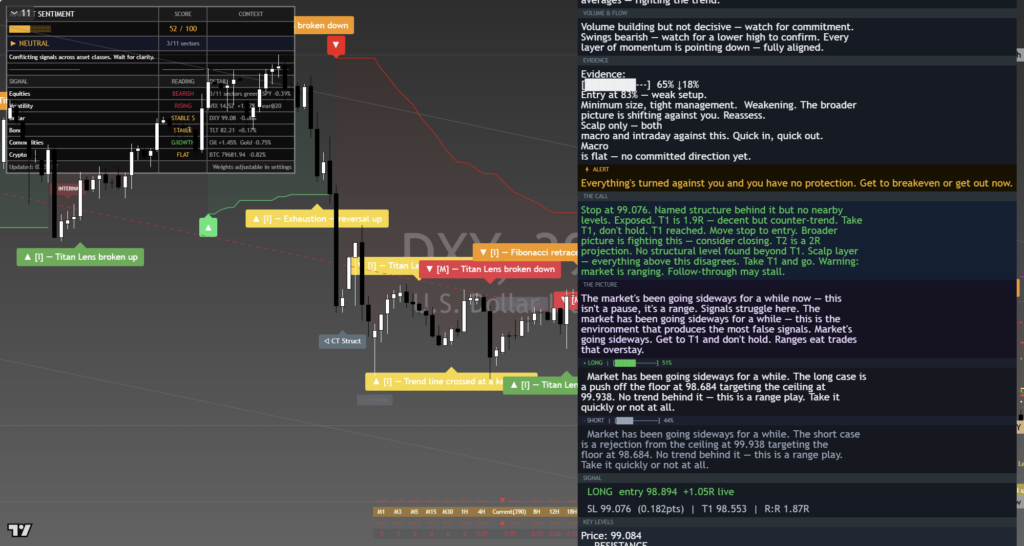
US Dollar Index (DXY) – Daily Read
7 September 2026 | Forex | Titan Macro Desk
$99.17
The US Dollar Index is consolidating rather than reversing, with last price 99.17, 0.0 percent higher on the day. It is sitting mid-range over the past month, but that apparent balance masks a softer underlying structure. The index remains beneath important reference points while its recent recovery lacks enough force to establish control. The clear view is cautiously bearish inside the range: dollar demand is stabilizing, yet buyers have not done enough to overturn the prevailing decline. That matters across Forex because the next escape from this compression can reset direction for major currency pairs and broader dollar-sensitive positioning.
The macro backdrop remains a contest between relative rate expectations, growth confidence, inflation risks, and demand for liquidity. DXY will strengthen if incoming information makes United States policy look firmer than policy elsewhere, or if defensive demand favors the dollar. It will weaken if markets lean toward easier United States policy, improved global risk appetite, or better relative prospects outside the United States. For this instrument specifically, the one month average is 99.22; price is below it, and the structure reads as a downtrend, price under both its one-month and longer averages. Momentum roughly 0.3 percent up over the last two weeks shows that selling pressure has eased, but the rebound is still corrective until price proves otherwise.
The first test overhead is the nearer round number handle at 100.00. It matters because reclaiming a prominent psychological boundary would improve buyer confidence and force defensive sellers to reassess. Above that sits the month swing high 100.08, about 0.9 percent above the current price. Sellers defending the broader downtrend should be most active there, since failure at that boundary preserves the sequence of weak recoveries. A decisive move above 100.08 opens the path toward 101.64, the upper edge of the three month range 98.56 to 101.64. That would represent more than a brief squeeze because it would remove the month’s main ceiling and shift attention toward the range extreme.
On the downside, a shelf of support at 98.56, about 0.6 percent below, is the key defense. Buyers have previously established demand there, making it the level that separates continued range trading from renewed downside discovery. The nearer round number handle at 98.00 becomes relevant only if that shelf gives way. Losing 98.56 exposes 98.00, where psychological demand may appear, but the break itself would confirm that sellers have regained initiative.
The bull path is straightforward: if DXY reclaims 100.00, holds above it, and then delivers a decisive move above 100.08, the recovery should broaden toward 101.64 as shorts retreat and buyers gain structural confirmation. The bear path is equally clean: if rallies remain capped beneath 99.22 and selling drives price through 98.56, then the downtrend resumes and 98.00 becomes the next destination. Continued trade between the shelf and the month high would instead signal indecision, rewarding patience rather than directional conviction.
The main risk to the bearish lean is a sustained reclaim of 100.08, which would invalidate the idea that the current bounce is merely corrective. The opposite invalidation for a bullish turn would be rapid rejection back beneath 99.22, especially if 98.56 then fails. Net, DXY is stable but structurally heavy: sellers retain the advantage below resistance, while only a confirmed breakout changes the desk view.
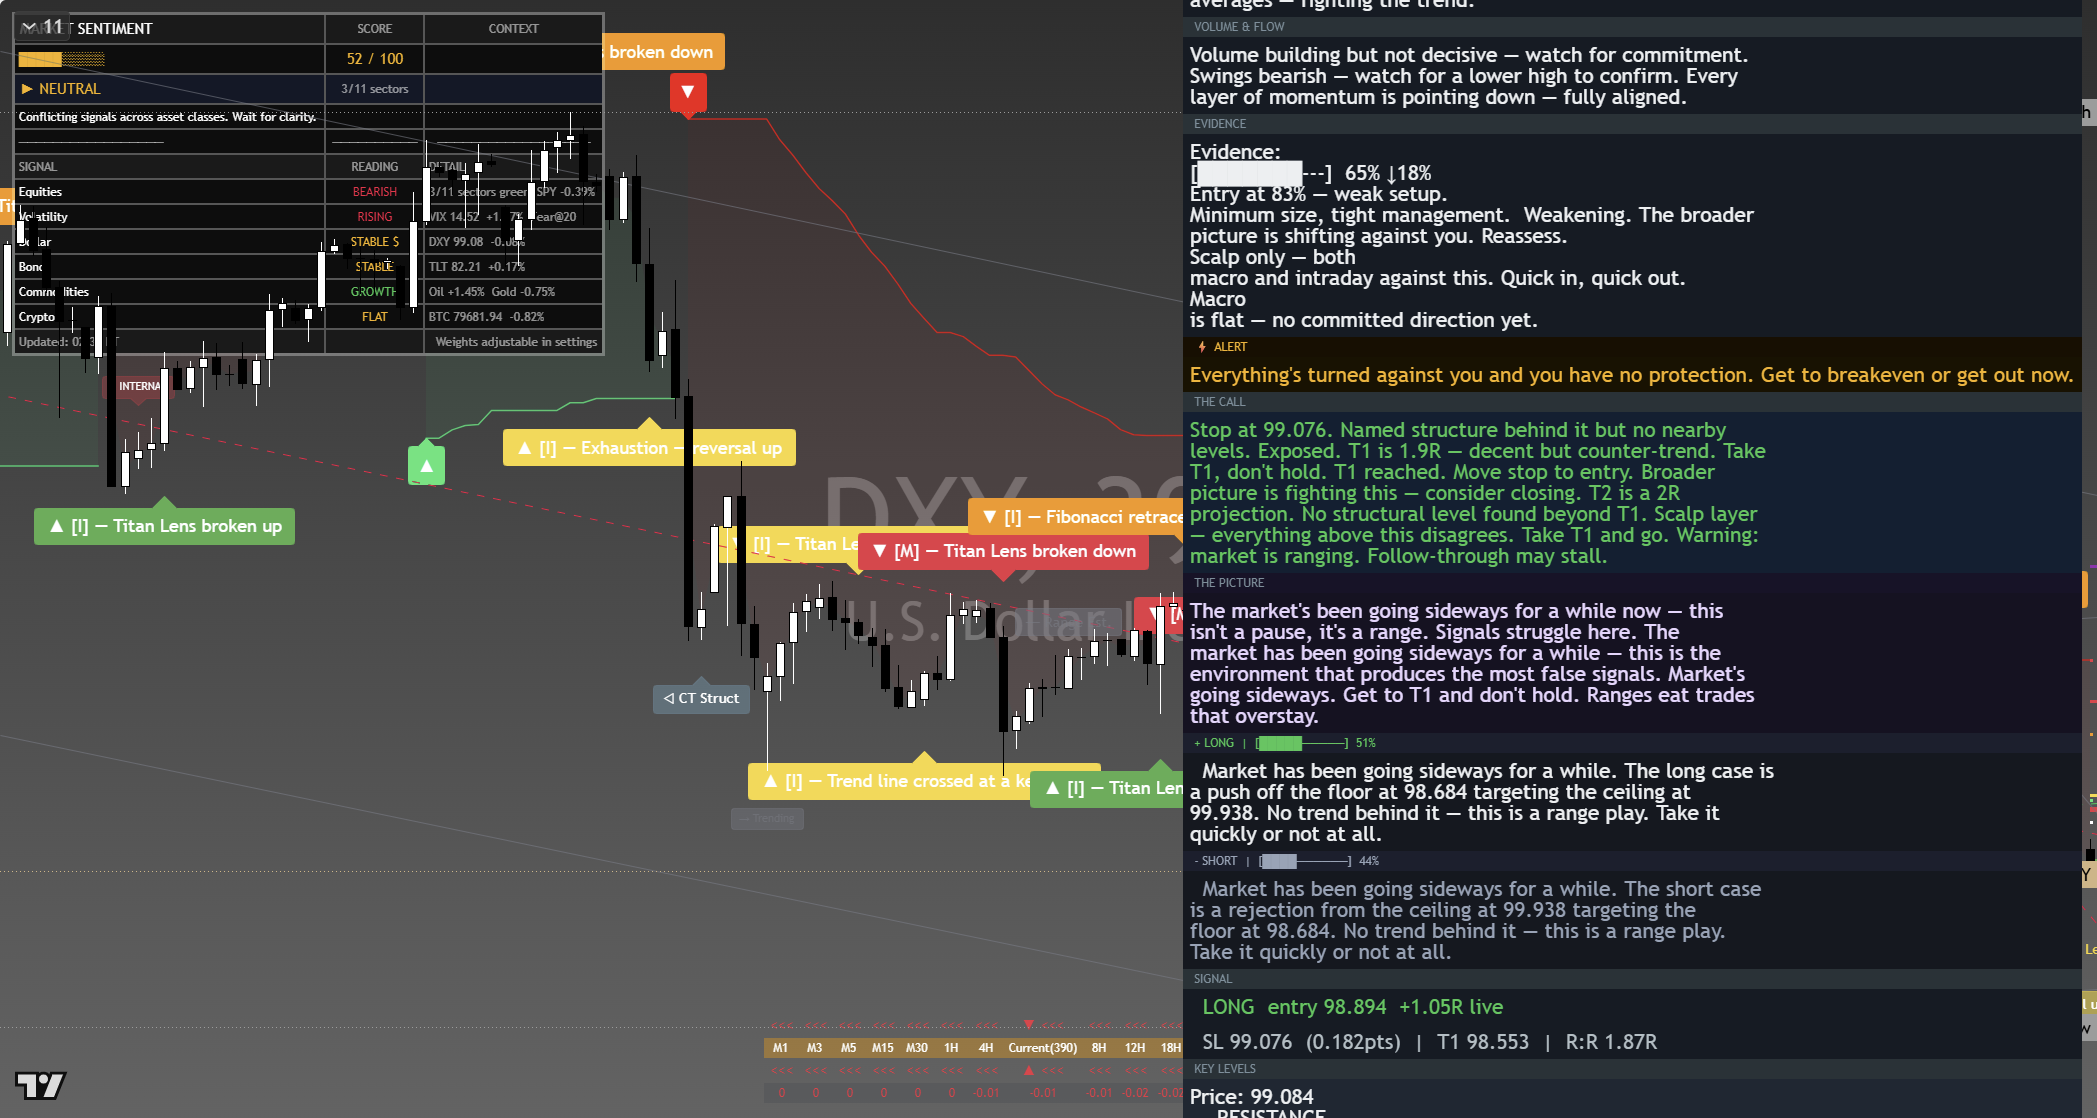
The chart above is the full daily read: structure, momentum, the levels that matter, and where the current price sits against them. Read it top to bottom for the complete picture, and pair it with our session briefs for the wider market context.
This is analysis, not financial advice. It reflects our multi-factor framework and is not a recommendation to buy or sell. Always do your own research and manage your risk.



