US Dollar Index (DXY) – Daily Read
2 September 2026 | Forex | Titan Macro Desk
$99.67
The US Dollar Index is attempting to turn a tentative recovery into a broader upside break, but it has not yet earned confirmation. Last price 99.67, 0.0 percent lower on the day. That flat performance masks a constructive underlying position: it is holding in the upper half of its one-month range, and the dollar has moved roughly 0.8 percent up over the last two weeks. The clear view is cautiously bullish while price remains above its recent balance area, although buyers still need to force a clean range expansion before the move can be treated as durable.
The macro backdrop is supportive but not one-way. Rising Treasury yields, firmer expectations for restrictive Federal Reserve policy, and renewed demand for defensive liquidity are helping the dollar. Higher oil prices and geopolitical tension reinforce inflation concerns, which makes an early policy retreat harder to price and preserves the dollar’s yield appeal. The complication is that softer US economic releases leave the market sensitive to incoming labor and inflation evidence. For DXY specifically, pressure on the euro and yen is providing support, but shifts in overseas policy expectations could narrow relative yield advantages and challenge the recovery.
The one month average is 99.38; price is above it, and the structure reads as a recovery attempt, back above the one-month average but still under the longer one. That makes 99.38 the immediate line separating improving demand from another loss of traction. The nearer round number handle at 100.00 is the first test of buyer commitment because it can attract profit-taking and fresh selling. Just beyond it, the month swing high is 100.08, about 0.4 percent above the current price. That is the decisive ceiling: supply there has already stopped advances, so acceptance above it would signal that buyers have absorbed nearby offers. The three month range is 98.56 to 101.64, making 101.64 the logical destination if the ceiling gives way. Below, a shelf of support at 98.56, about 1.1 percent below, is defended by prior range demand. The nearer round number handle at 98.00 becomes relevant only if that shelf fails.
If buyers push through 100.00 and deliver a decisive move above 100.08, then the recovery becomes a credible continuation move and opens the path toward 101.64. Follow-through would matter more than a brief probe, because sustained trade above the prior high would show that the market is comfortable carrying dollar exposure at richer levels. If price instead rejects the ceiling and falls back through 99.38, then the recovery thesis weakens and attention returns to 98.56. Losing 98.56 exposes 98.00, with the break implying that the recent improvement was merely rotation inside the wider range.
The central risk is a reversal in US yields or a policy repricing driven by weaker domestic data, while improving global risk appetite could reduce defensive dollar demand. Conversely, another inflation or geopolitical shock could accelerate the upside. A sustained loss of 98.56 would invalidate the constructive read. Net, DXY has a bullish lean, but 100.08 remains the gate that separates recovery from breakout.
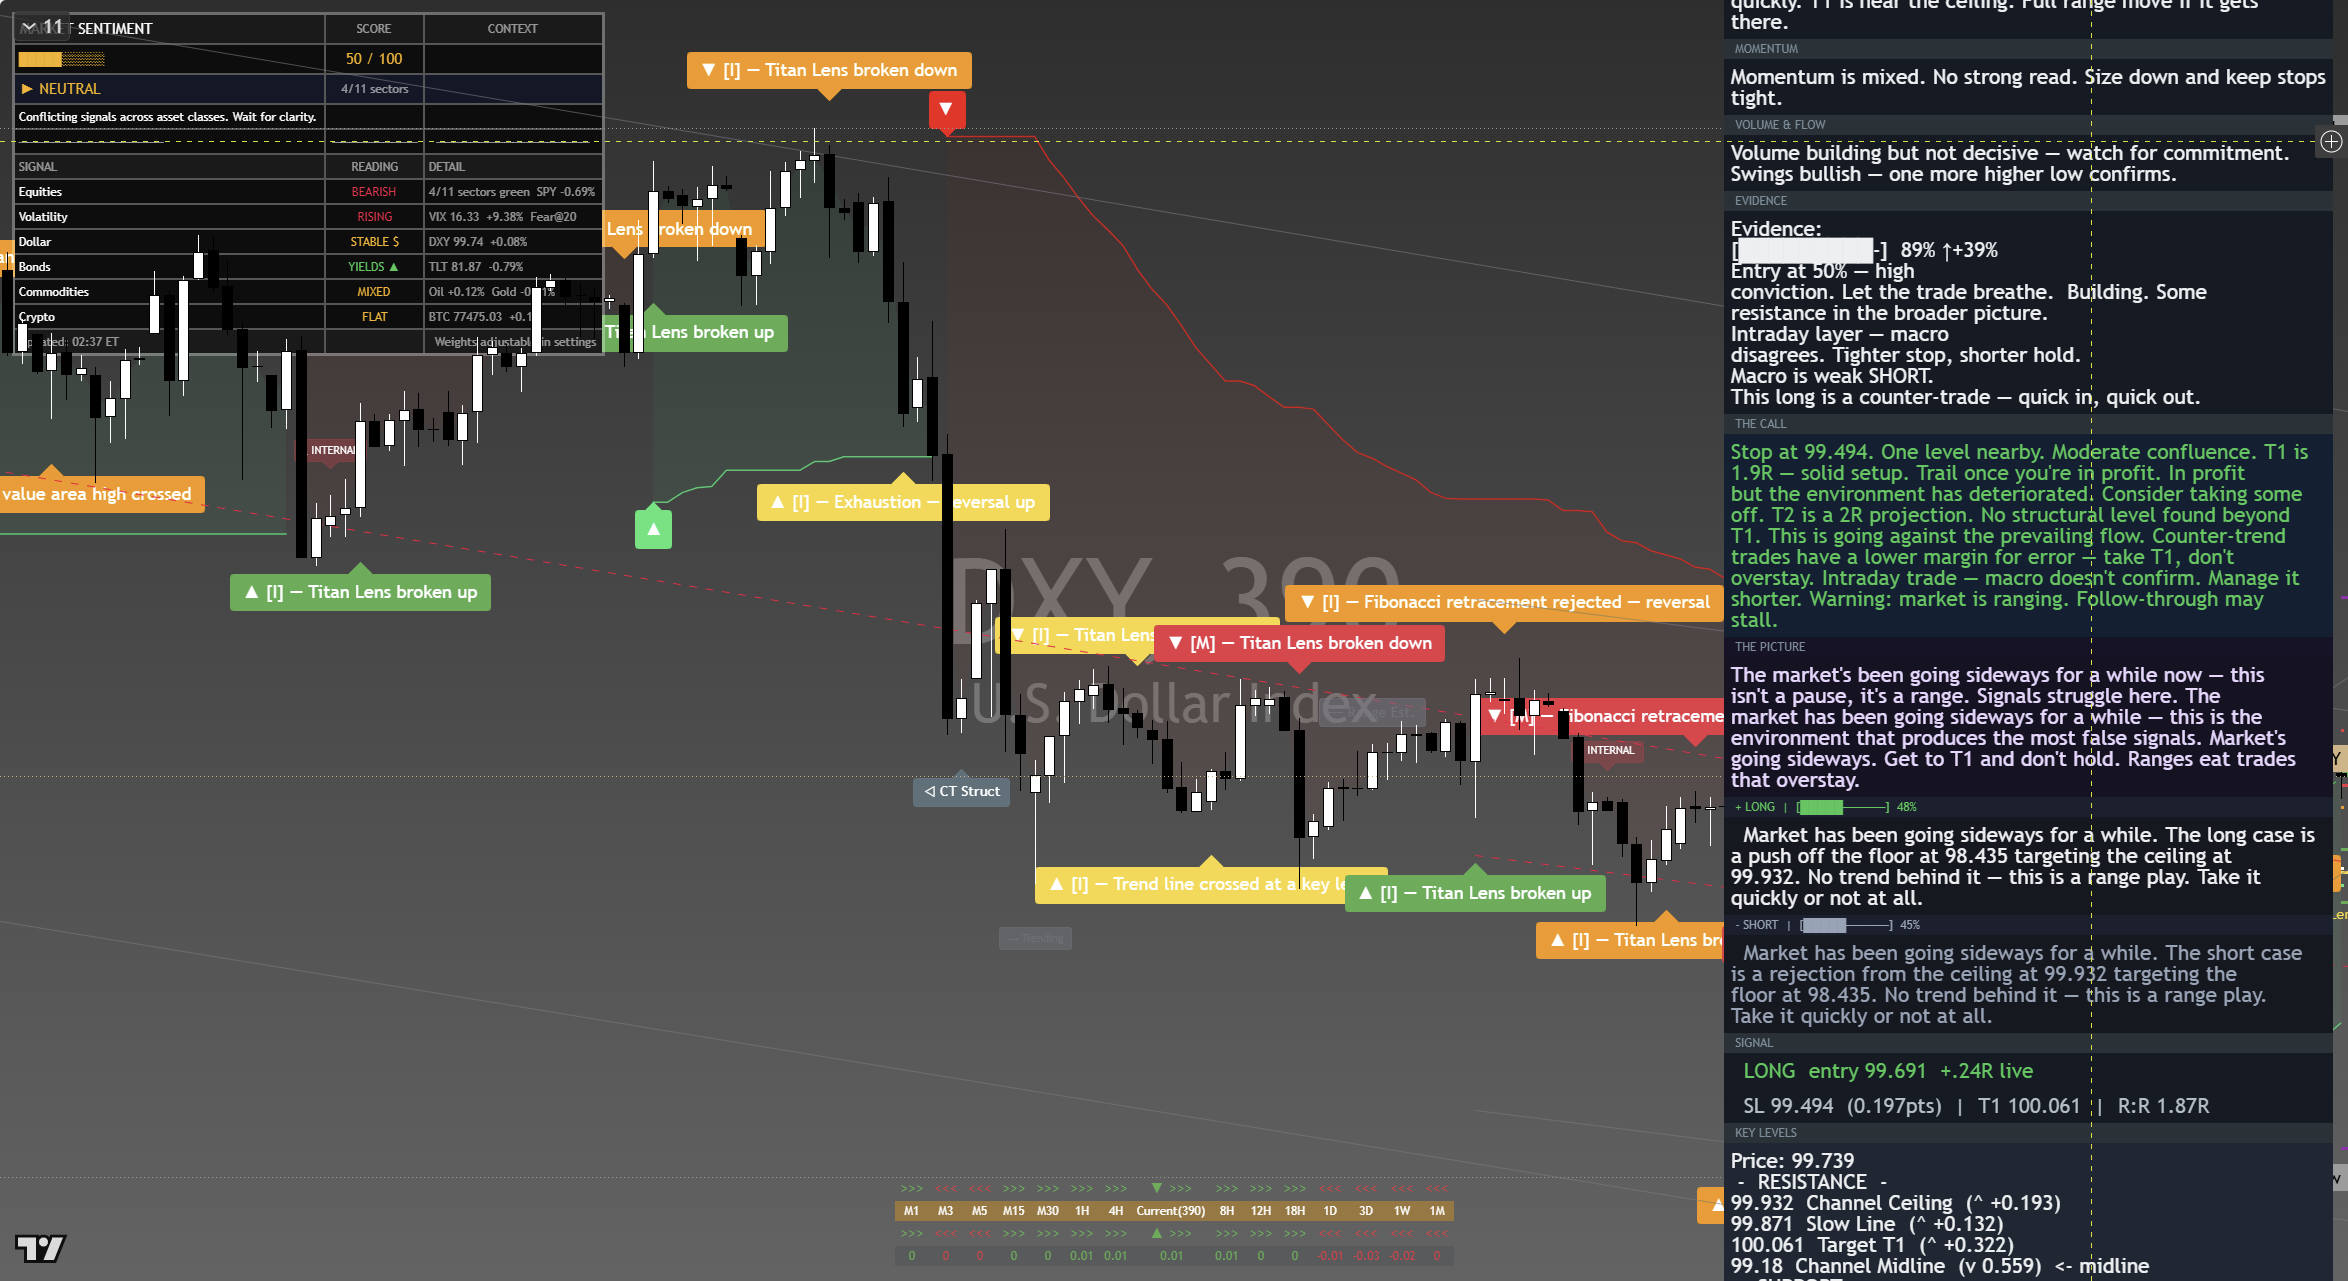
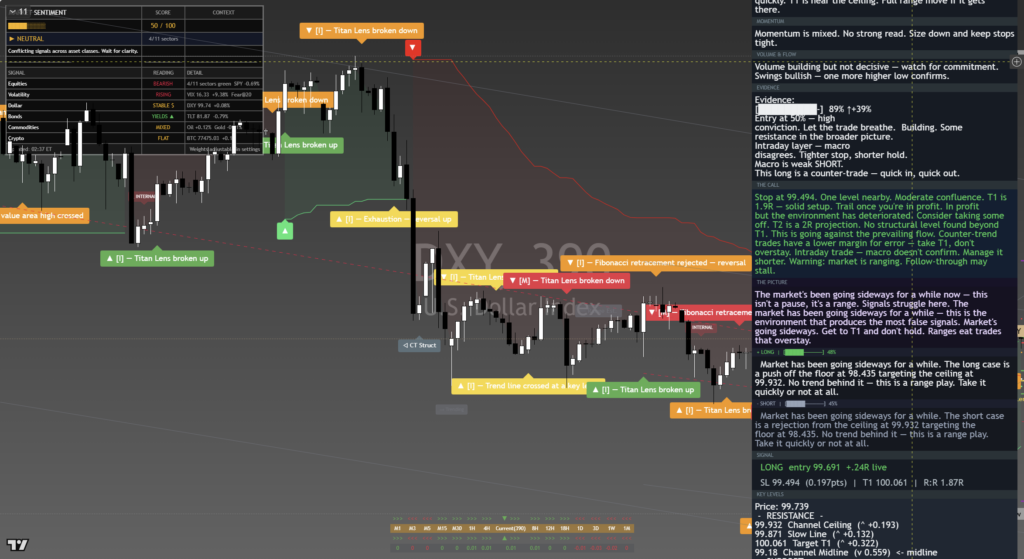
The chart above is the full daily read: structure, momentum, the levels that matter, and where the current price sits against them. Read it top to bottom for the complete picture, and pair it with our session briefs for the wider market context.
This is analysis, not financial advice. It reflects our multi-factor framework and is not a recommendation to buy or sell. Always do your own research and manage your risk.