Crude Oil (WTI) – Daily Read
20 September 2026 | Commodity | Titan Macro Desk
$95.47
WTI is undergoing a sharp reset inside a broader bullish structure, rather than showing a confirmed trend reversal. Last price $95.47, 5.6 percent lower on the day. That decline matters because it tests whether buyers still have conviction after an extended advance, but the market is holding in the upper half of its one-month range. The clear view is that the trend remains constructive while nearby support absorbs the selloff, although the size of the daily decline raises the burden of proof for bulls. A quick stabilization would signal healthy position clearing. Continued heavy selling would suggest that the market is repricing more than short-term excess.
The macro backdrop is defined by competing forces across commodities. Supply uncertainty and geopolitical risk can sustain an energy premium, while concern about demand, restrictive financial conditions, or softer industrial activity can pressure crude quickly. Oil is especially sensitive because positioning often amplifies changes in the perceived balance between available supply and expected consumption. Momentum roughly 1.5 percent up over the last two weeks, so the latest decline interrupts positive progress without yet erasing it. The one month average $93.79 sits below the market, and the structure reads as a clean uptrend, price above both its one-month and longer averages. That keeps the larger direction favorable despite the abrupt pullback.
The immediate battle is around the nearer round number handles at $96.00 and $94.00. Reclaiming $96.00 would show that sellers could not hold control after the drop and would give buyers a platform for another push higher. Holding $94.00 would preserve the market’s position above its one month average $93.79 and support the case that this is consolidation within an advance. A sustained move below that area would weaken the structure and increase the chance of a deeper retracement. Above, the month swing high $105.63, about 10.6 percent above the current price, is the defining resistance because it marks where the previous advance exhausted. Below, a shelf of support at $79.62, about 16.6 percent below, is the major structural defense. The three month range $68.08 to $105.63 frames the broader battlefield.
The bull path is straightforward: if WTI holds $94.00, recovers $96.00, and attracts follow-through buying, then the market can rebuild toward $105.63. A decisive move above $105.63 opens the path toward $107.63, because clearing the range ceiling would confirm renewed demand at previously rejected prices. The bear path begins if $94.00 fails and price cannot recover the one month average $93.79. That would turn the current drop into a broader loss of control. If selling then reaches and defeats $79.62, losing $79.62 exposes $68.08 and signals that the clean uptrend has broken.
The main risk to the bullish read is that the daily fall reflects a durable change in demand expectations or supply conditions rather than position clearing. Failure to regain $96.00, followed by acceptance below $94.00 and the one month average $93.79, would invalidate the near-term recovery case. Conversely, rapid stabilization would leave the broader advance intact. Net, WTI remains structurally bullish but tactically bruised, with buyers still favored above core support and sellers gaining authority only if the market begins breaking successive defenses.
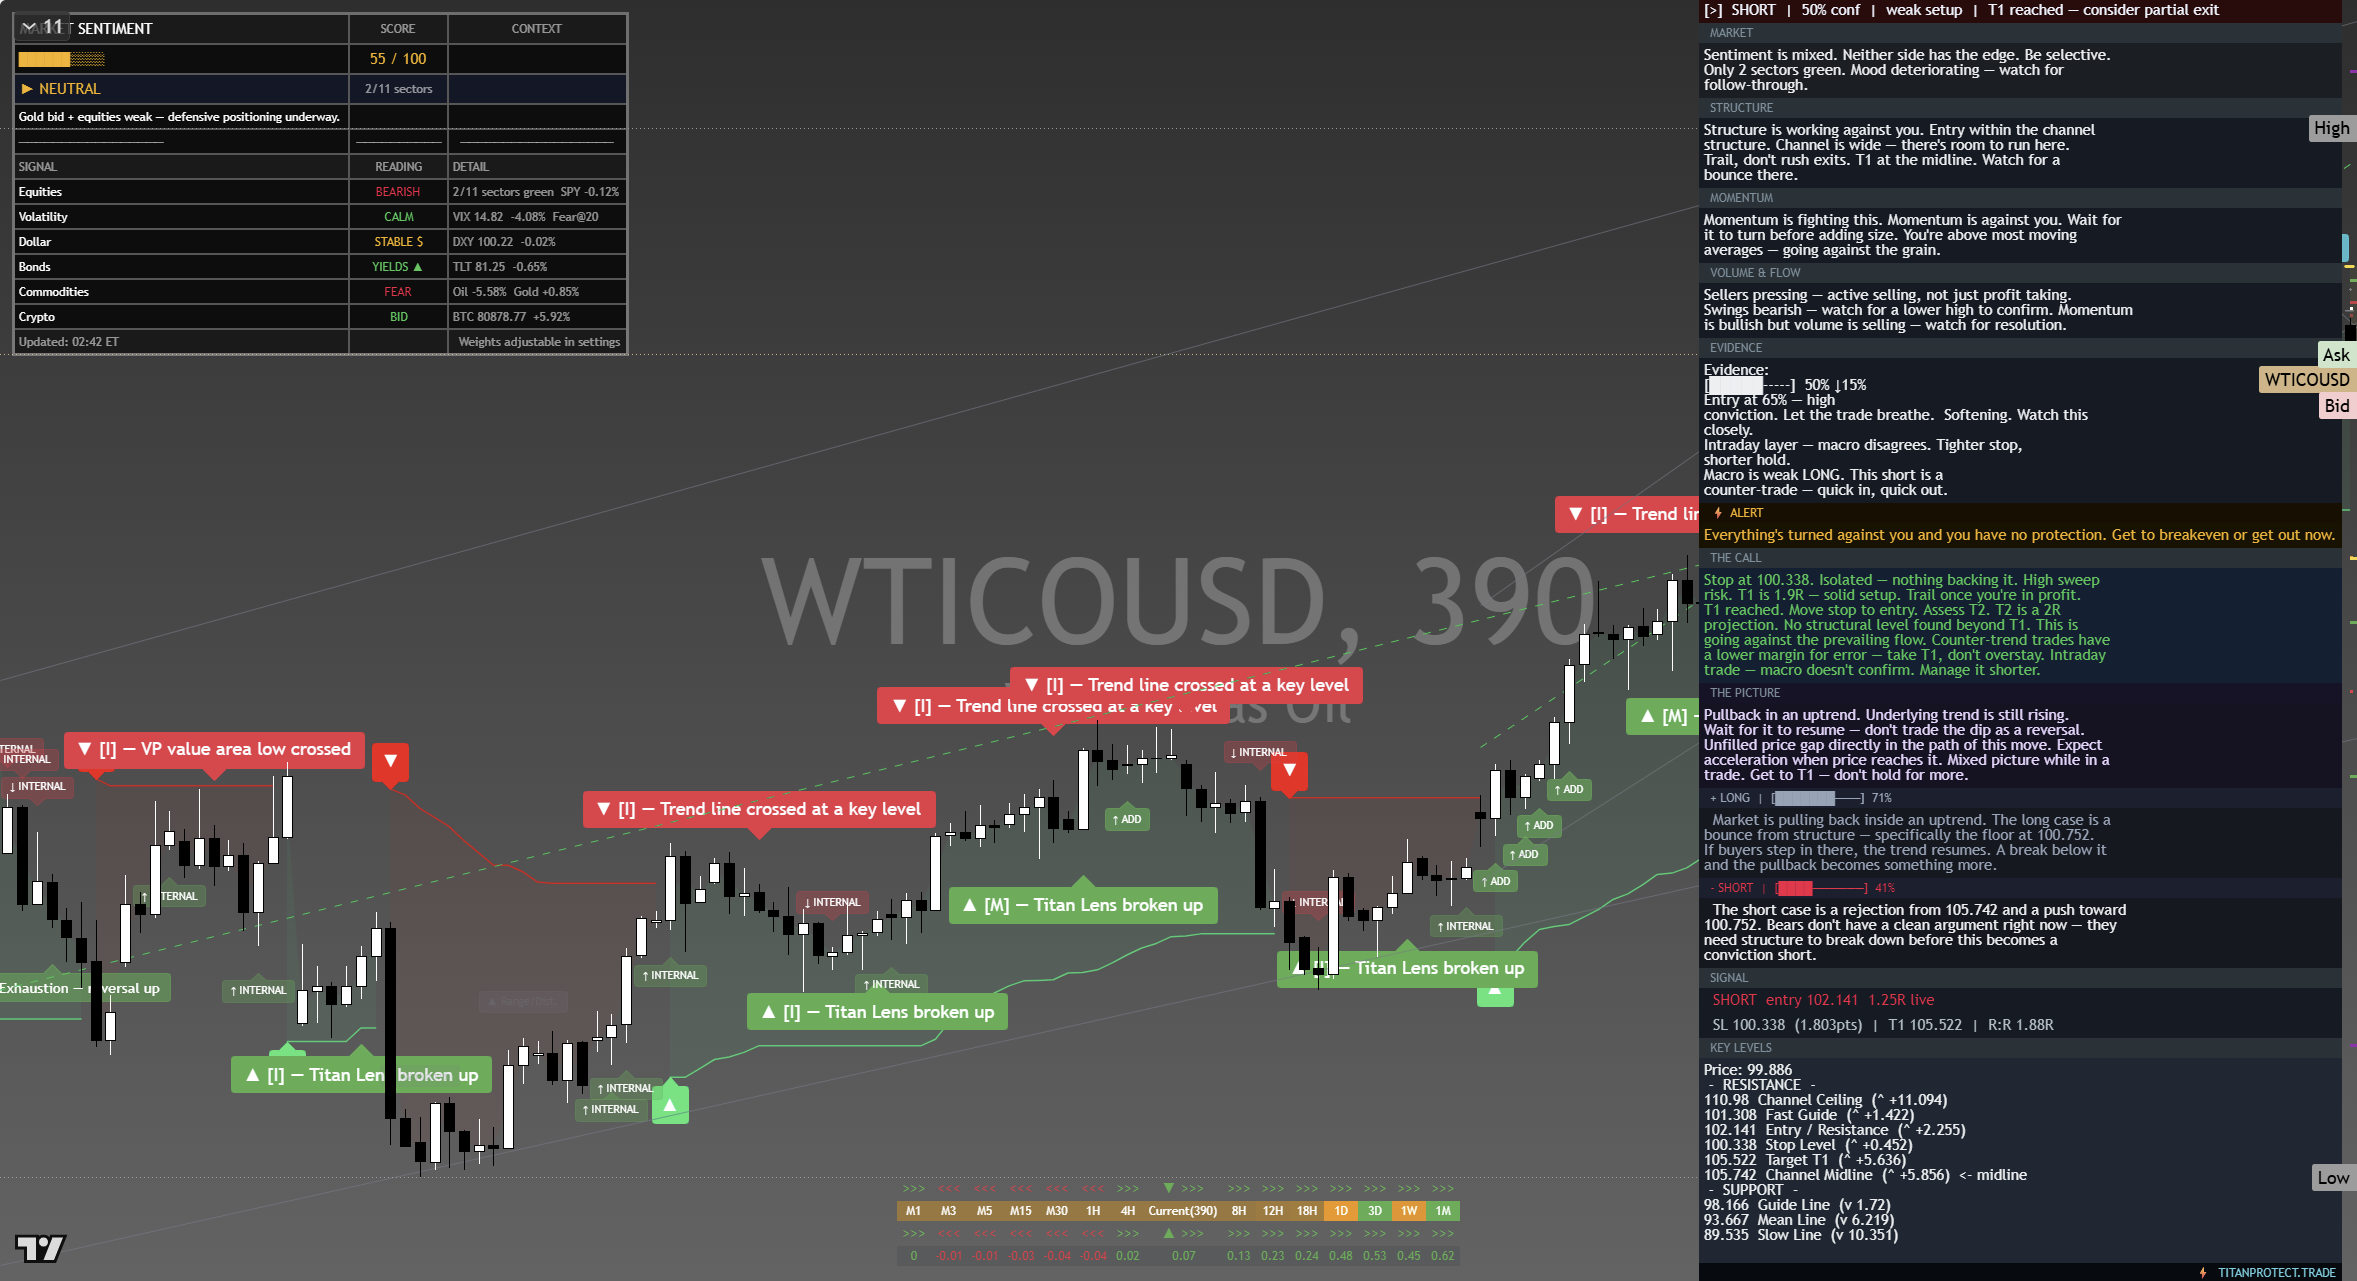
The chart above is the full daily read: structure, momentum, the levels that matter, and where the current price sits against them. Read it top to bottom for the complete picture, and pair it with our session briefs for the wider market context.
This is analysis, not financial advice. It reflects our multi-factor framework and is not a recommendation to buy or sell. Always do your own research and manage your risk.