Bitcoin (BTC) – Daily Read
2 October 2026 | Crypto | Titan Macro Desk
$86,307.01
Bitcoin is testing the upper boundary of its recent range with a constructive trend but incomplete confirmation. Last price is $86,307, 2.0 percent higher on the day, and it is pressing the top of its one-month range. That matters because acceptance above the range would convert persistent demand into a fresh expansion, while another rejection would reinforce the idea that buyers are becoming less effective near the highs. The view is cautiously bullish: the structure supports continuation, but price still has to prove it can absorb supply at the range ceiling.
The broader macro backdrop matters through liquidity, risk appetite, and expectations for the path of policy, all of which can amplify crypto moves without providing dependable support on their own. Bitcoin is also trading on its own market structure, where strength near a major range boundary can attract breakout demand but can equally invite profit-taking. The one month average is $81,563; price is above it, and the structure reads as a clean uptrend, price above both its one-month and longer averages. The caveat is that momentum is roughly 0.4 percent down over the last two weeks. That divergence in behavior says the trend remains intact, but the push behind it has softened as price approaches resistance.
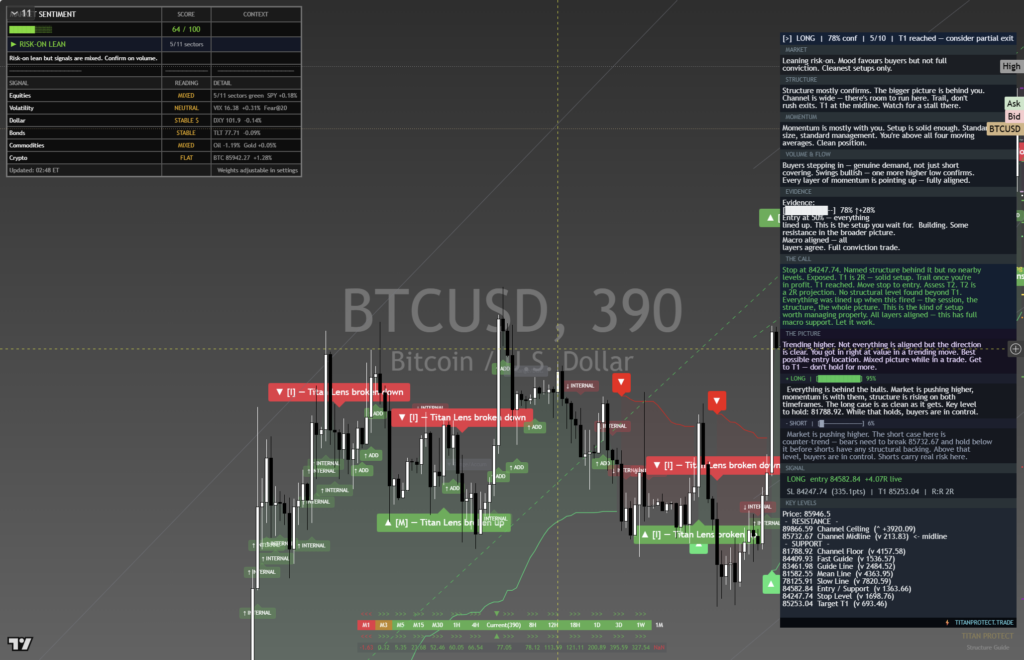
The month swing high is $87,281, about 1.1 percent above the current price. This is the immediate decision point because it marks the highest price buyers have sustained during the current advance. Supply from prior buyers taking profit and sellers leaning against the range should defend it. A decisive move above $87,281 opens the path toward $87,500, where the nearer round number handle may briefly concentrate orders and test whether the breakout has genuine follow-through. The other nearer round number handle is $85,000. Holding it would show that buyers are willing to defend shallow pullbacks and keep pressure on the highs. Losing it would not destroy the trend, but it would weaken the immediate breakout case and shift attention back toward the average. A shelf of support at $74,985, about 13.1 percent below, is the deeper structural defense. The full three month range is $62,235 to $87,281, so failure at the top followed by a loss of that shelf would represent a meaningful change in control.
The bull path is straightforward: if price clears $87,281 decisively and holds above it, then the market can probe $87,500, with acceptance there confirming that former range resistance is becoming support. If pullbacks then remain contained above $85,000, buyers retain tactical control and the trend can extend. The bear path begins with rejection near the highs. If price falls through $85,000 and cannot reclaim it, then fading momentum becomes more consequential and a rotation toward $81,563 becomes credible. If that area also fails to stabilize the market, then pressure can build toward $74,985. Losing $74,985 exposes $62,235 and would turn an orderly pullback into a broader range reversal.
The main risk to the bullish read is a breakout that cannot hold, especially if macro conditions simultaneously reduce demand for volatile assets. The read is invalidated by sustained trade below $74,985 because that would break the support shelf underpinning the current structure. Net, Bitcoin has the trend and proximity needed for an upside break, but conviction belongs above resistance, not merely beneath it.
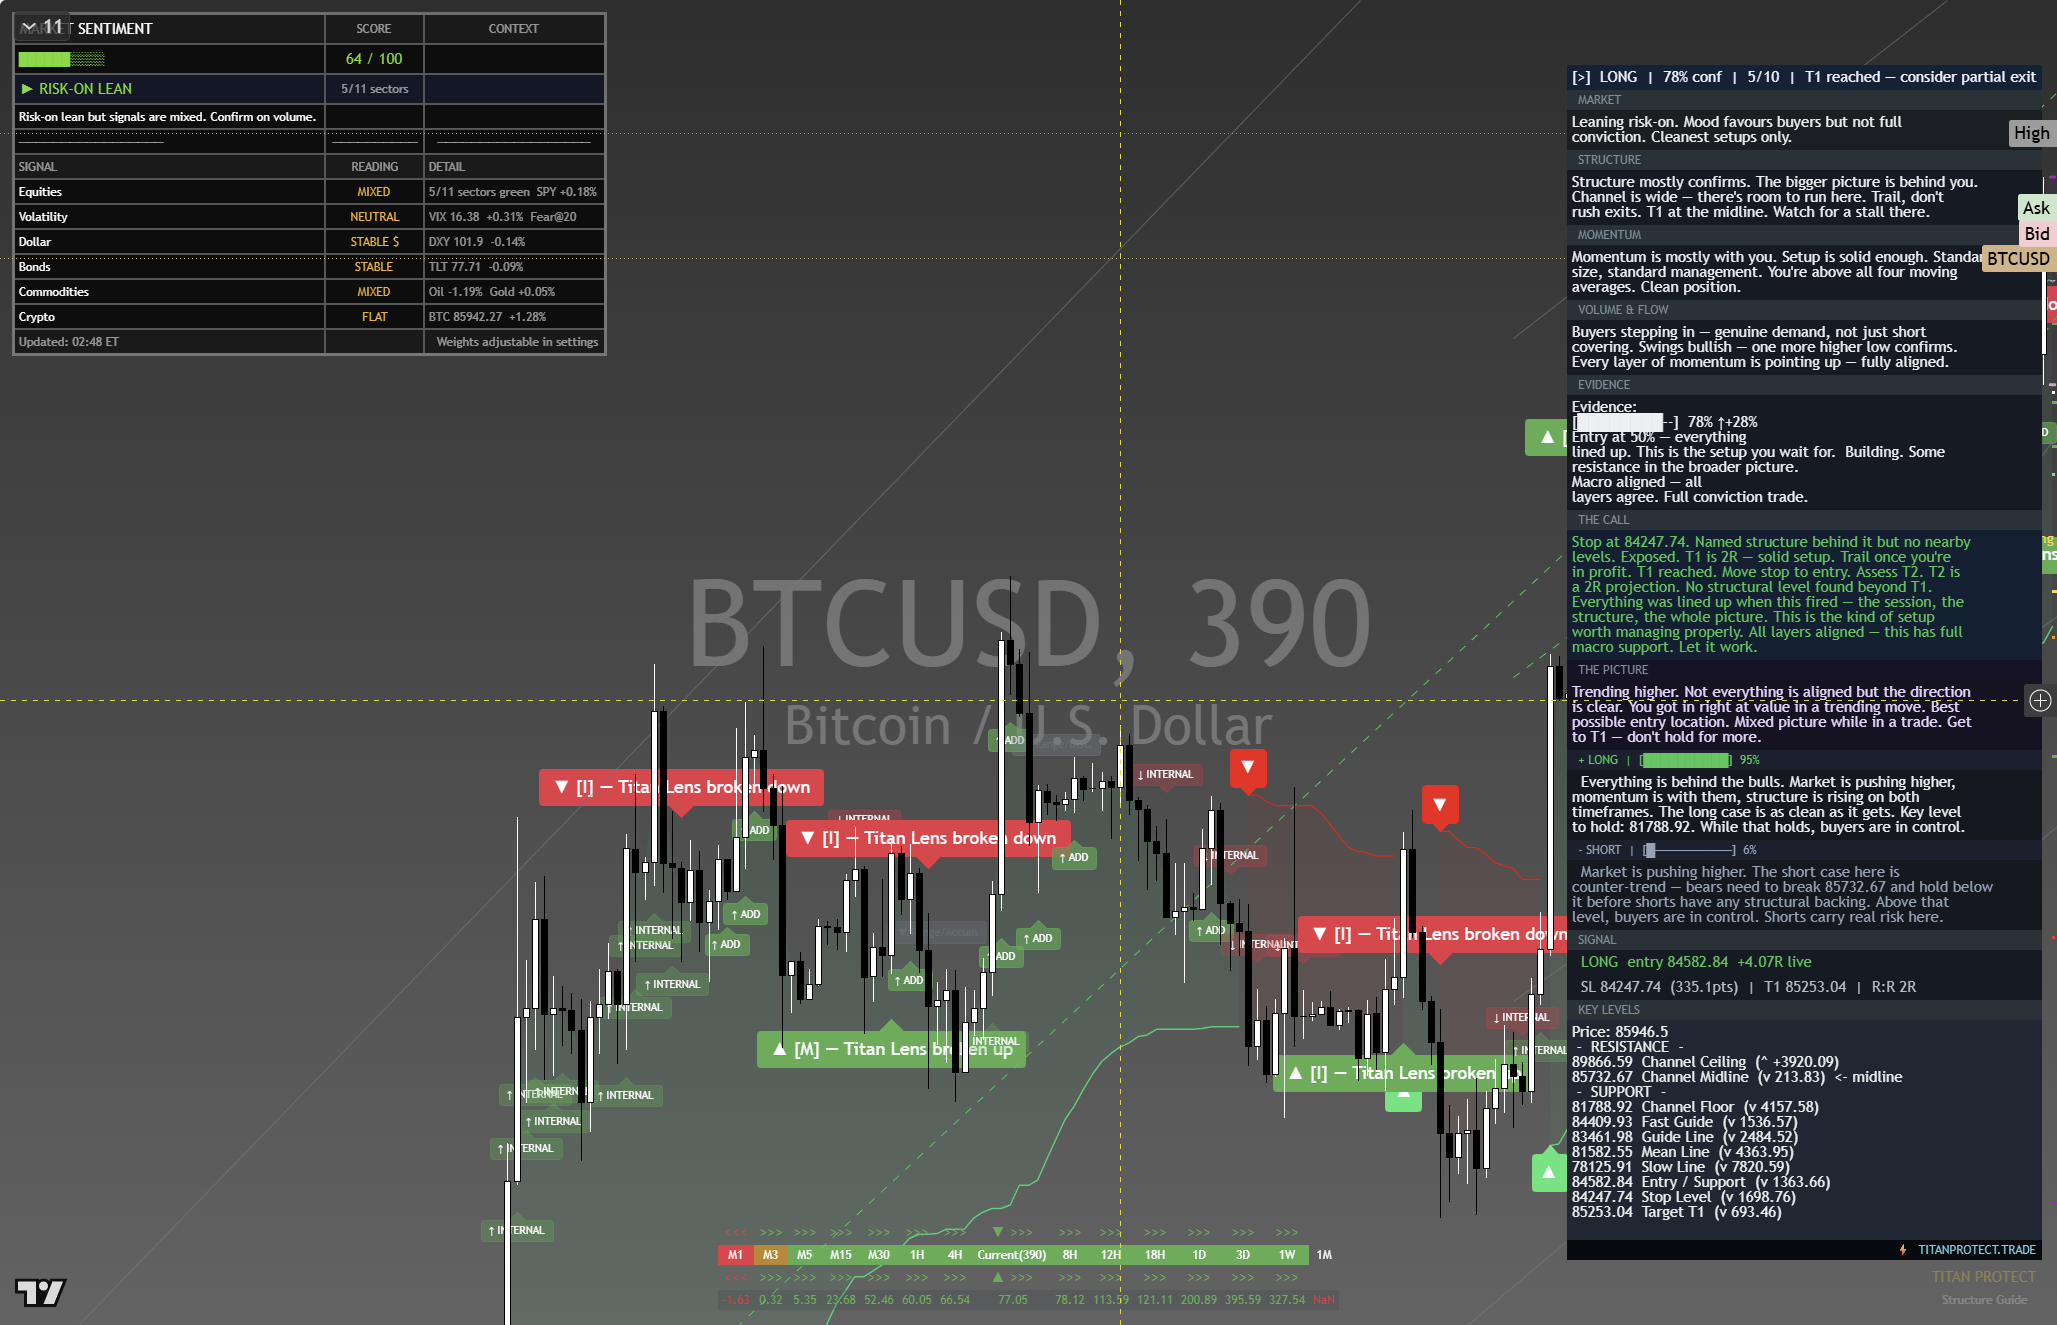
The chart above is the full daily read: structure, momentum, the levels that matter, and where the current price sits against them. Read it top to bottom for the complete picture, and pair it with our session briefs for the wider market context.
This is analysis, not financial advice. It reflects our multi-factor framework and is not a recommendation to buy or sell. Always do your own research and manage your risk.