Bitcoin (BTC) – Daily Read
13 September 2026 | Crypto | Titan Macro Desk
$77,135.67
Bitcoin is consolidating rather than breaking down. Last price $77,136, 0.2 percent lower on the day, and it is holding in the upper half of its one-month range. The important tension is between a soft near-term structure and a longer trend that still points up. That makes this a decision area rather than a clean directional trade. Buyers retain strategic control, but they need to reclaim nearby resistance before the pullback can credibly turn into renewed expansion.
The macro backdrop remains about liquidity expectations, risk appetite, and the market’s tolerance for volatile assets. Bitcoin is especially sensitive to changes in real-rate expectations, dollar direction, and demand for scarce assets, so unstable cross-asset conditions can quickly interrupt otherwise constructive positioning. Within crypto, the immediate catalyst is whether capital treats current weakness as an opportunity to rebuild exposure or as a reason to reduce risk. Momentum is roughly 0.3 percent down over the last two weeks, consistent with cooling demand rather than aggressive liquidation. The one month average $78,320 sits above price, and the structure reads as a pullback, slipping under the one-month average while the longer trend still points up.
The first meaningful contest is around $77,500. That handle matters because a sustained recovery through it would show that buyers can absorb supply close to the market and begin repairing the short-term structure. Until then, rallies remain vulnerable to selling. The $75,000 handle is the nearer defensive line. Holding it would preserve the idea of an orderly pullback, while losing it would suggest that sellers are gaining control and that demand may need to emerge deeper in the range.
Above, the month swing high $81,763, about 6.0 percent above the current price, is the defining ceiling. It is also the upper boundary of the three month range $58,397 to $81,763, so supply there should be respected. A decisive move above $81,763 opens the path toward $84,263 because it would represent acceptance beyond the established range, not merely another test of resistance. Below, a shelf of support at $64,004, about 17.0 percent below, is the major structural defense. That area separates a contained correction from a broader deterioration. Losing $64,004 exposes $58,397 and would place the entire three-month advance under pressure.
The bull path is straightforward: if Bitcoin retakes $77,500, then reclaims the one month average $78,320 and holds above it, buyers gain room to challenge $81,763. If that ceiling breaks decisively, then $84,263 becomes the next destination as sidelined capital and defensive positioning chase the breakout. The bear path begins if $75,000 fails. If selling then persists and rebounds cannot recover that handle, pressure can build toward $64,004. If that shelf breaks, then $58,397 becomes exposed as the range seeks a lower clearing level.
The main risk to the constructive view is that mild weakness develops into persistent distribution while broader risk appetite contracts. A failure to recover $78,320 keeps the pullback active, but the decisive invalidation is a loss of $64,004. Conversely, sustained acceptance above $81,763 invalidates the bearish range case. Net, Bitcoin remains structurally constructive but tactically unfinished: buyers have the longer-term advantage, while sellers control the immediate test until nearby resistance is reclaimed.
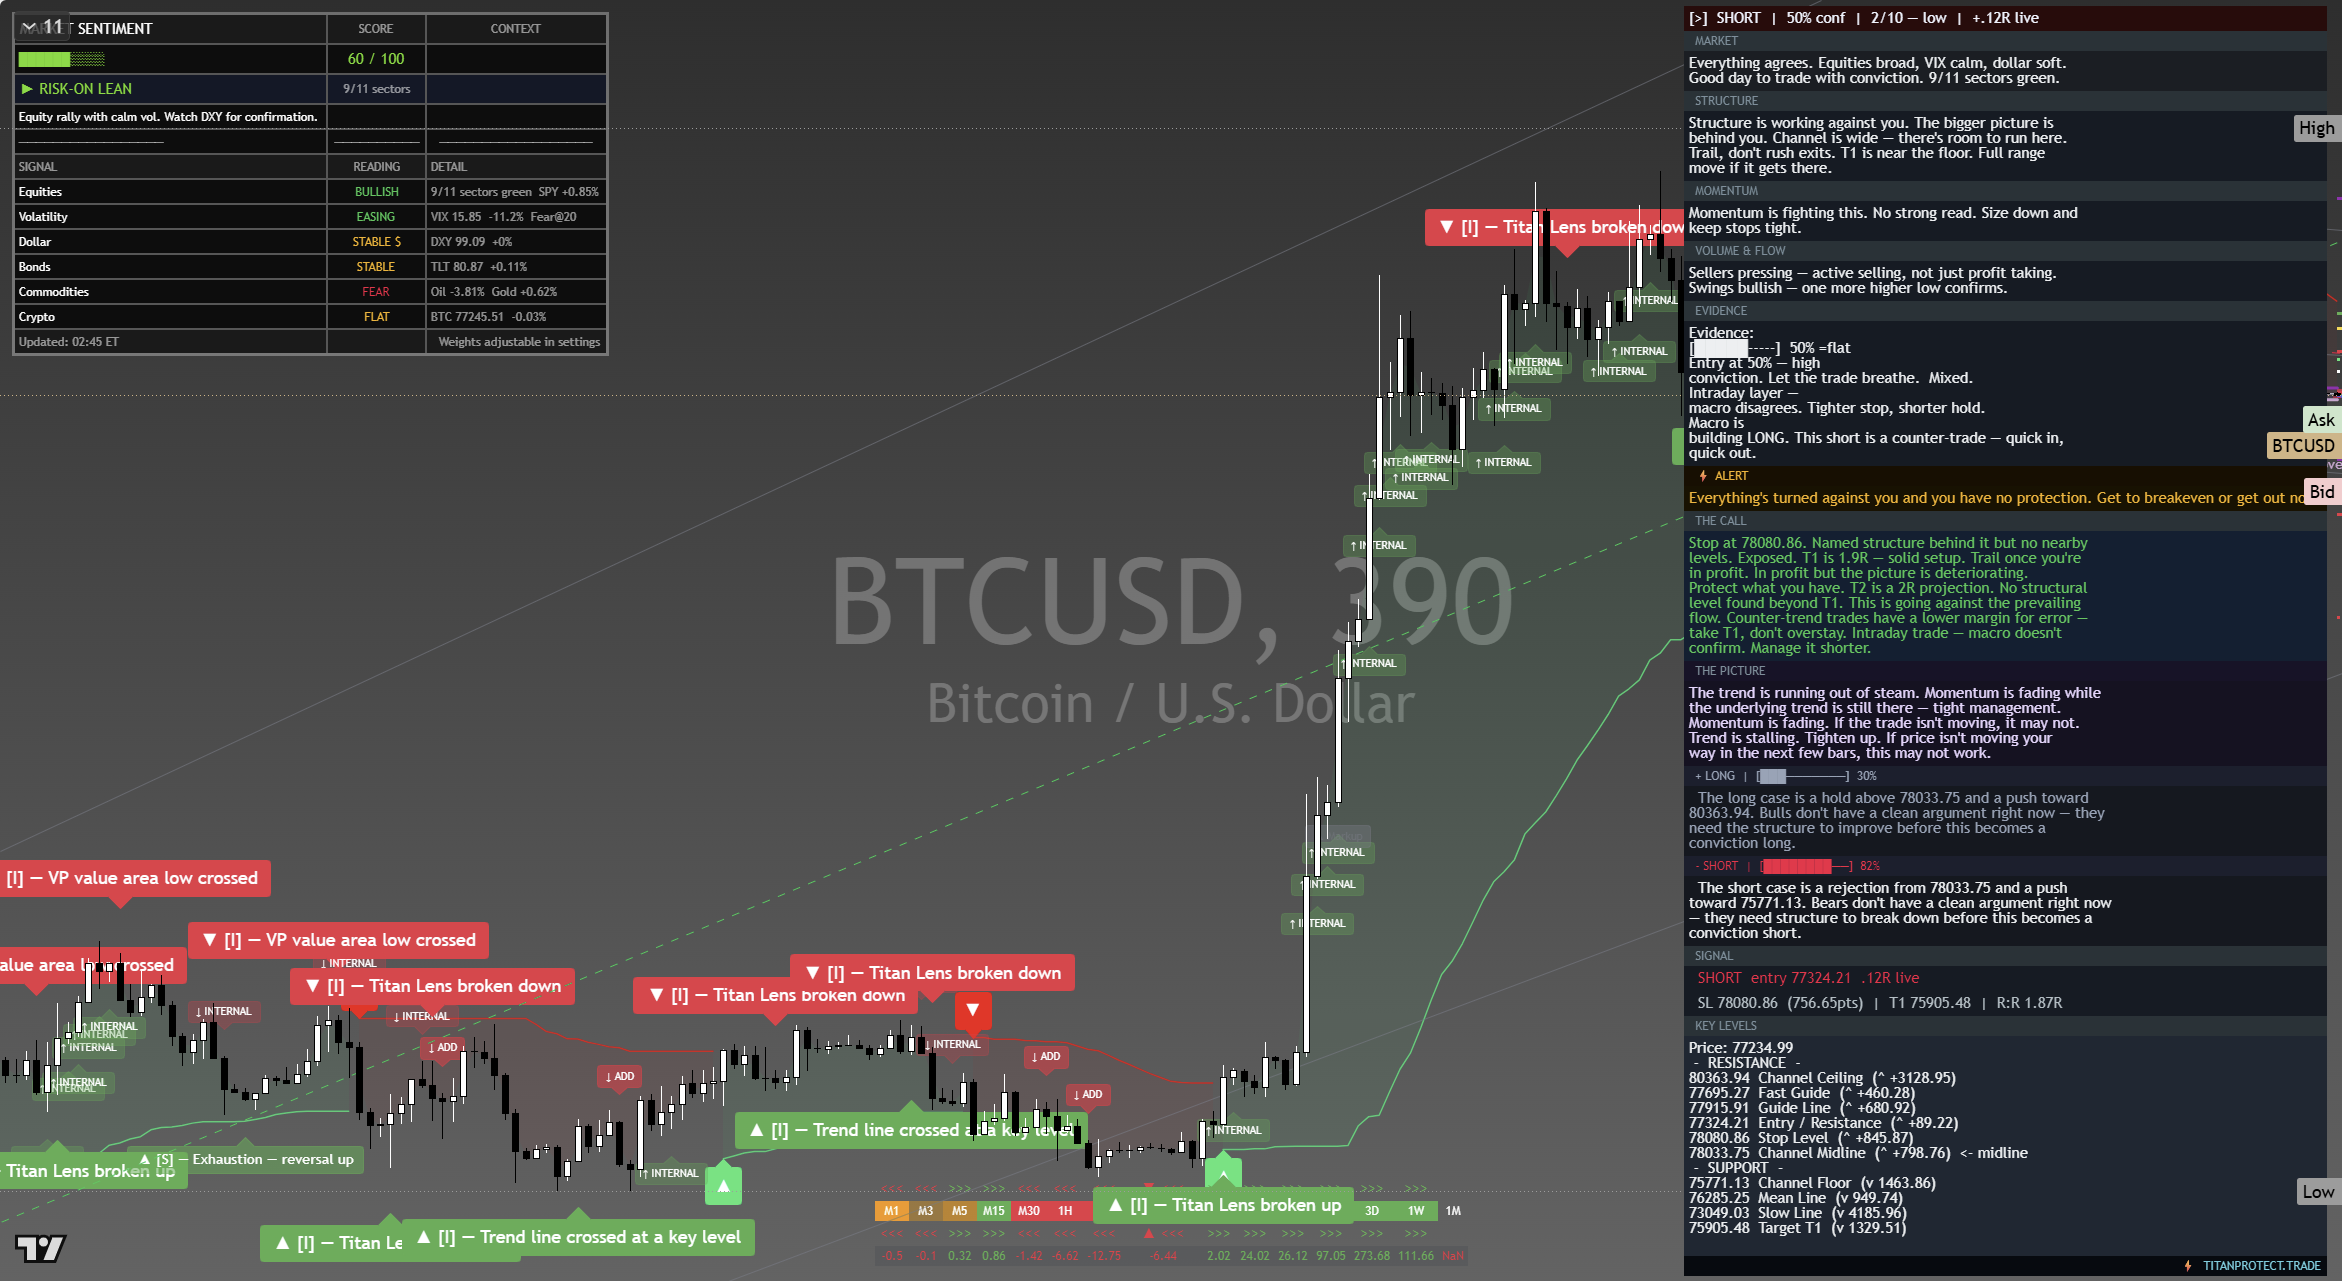
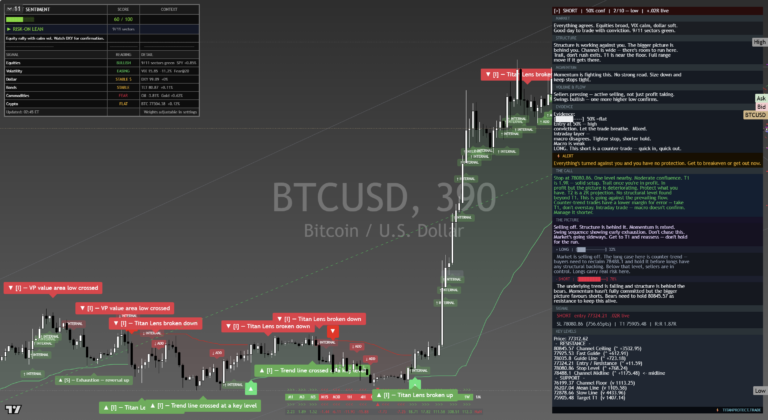
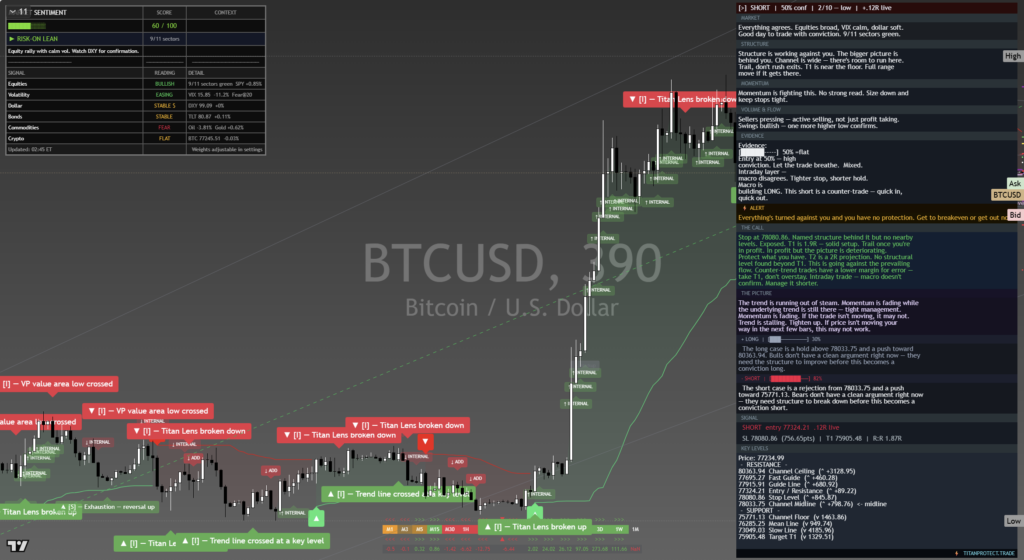
The chart above is the full daily read: structure, momentum, the levels that matter, and where the current price sits against them. Read it top to bottom for the complete picture, and pair it with our session briefs for the wider market context.
This is analysis, not financial advice. It reflects our multi-factor framework and is not a recommendation to buy or sell. Always do your own research and manage your risk.