AMD – Daily Read
12 September 2026 | Stock | Titan Macro Desk
$516.13
AMD is attempting to convert a sharp recovery into a durable breakout. The last price is $516.13, 2.5 percent higher on the day, with the stock pressing the top of its one-month range. That matters because buyers have regained near-term control, but they are now entering the area where conviction must replace momentum. The clear view is constructive while the recovery holds, although the stock still needs to clear nearby supply before the broader structure turns decisively bullish.
The macro backdrop remains important because growth stocks are especially sensitive to changes in risk appetite, liquidity expectations, and confidence in future earnings. For AMD specifically, the market is balancing enthusiasm around semiconductor demand and computing investment against the demanding expectations already embedded in the share price. Momentum is roughly 8.3 percent up over the last two weeks, showing that investors have been willing to pay progressively higher prices. The one month average is $481.99. Price is above it, and the structure reads as a recovery attempt, back above the one-month average but still under the longer one. That combination supports further upside, but it also warns that the larger trend has not yet fully confirmed the move.
The nearest handles are $520.00 and $510.00. Holding above $510.00 would show that buyers are absorbing routine profit-taking and treating shallow weakness as an entry opportunity. Sustained trade above $520.00 would improve the odds of a test of the month swing high at $526.79, about 2.1 percent above the current price. That high is the immediate decision point because it marks the ceiling buyers have not yet overcome. A decisive move above $526.79 opens the path toward $574.20, the upper boundary of the three month range of $318.86 to $574.20.
On the downside, the one month average at $481.99 is the first meaningful structural reference. Losing it would weaken the recovery narrative and suggest that the latest advance was driven more by short-term enthusiasm than durable accumulation. The deeper shelf of support at $440.50, about 14.7 percent below, is more consequential. It represents the level that must defend the broader rebound. Losing $440.50 exposes $318.86 and would signal a substantial deterioration in market confidence.
The bull path is straightforward: if AMD holds $510.00, establishes acceptance above $520.00, and then breaks $526.79 decisively, buyers should have room to pursue $574.20. The bear path begins if rejection near the range top pushes price below $510.00. If that weakness then carries through $481.99, the recovery loses credibility, and a failure at $440.50 would shift the focus toward $318.86.
The main risk is a broad reversal in growth-stock appetite just as AMD confronts overhead supply. The bullish read is invalidated by sustained weakness below $481.99 and decisively overturned below $440.50. Net, AMD has earned a constructive bias, but confirmation requires a clean break of $526.79.
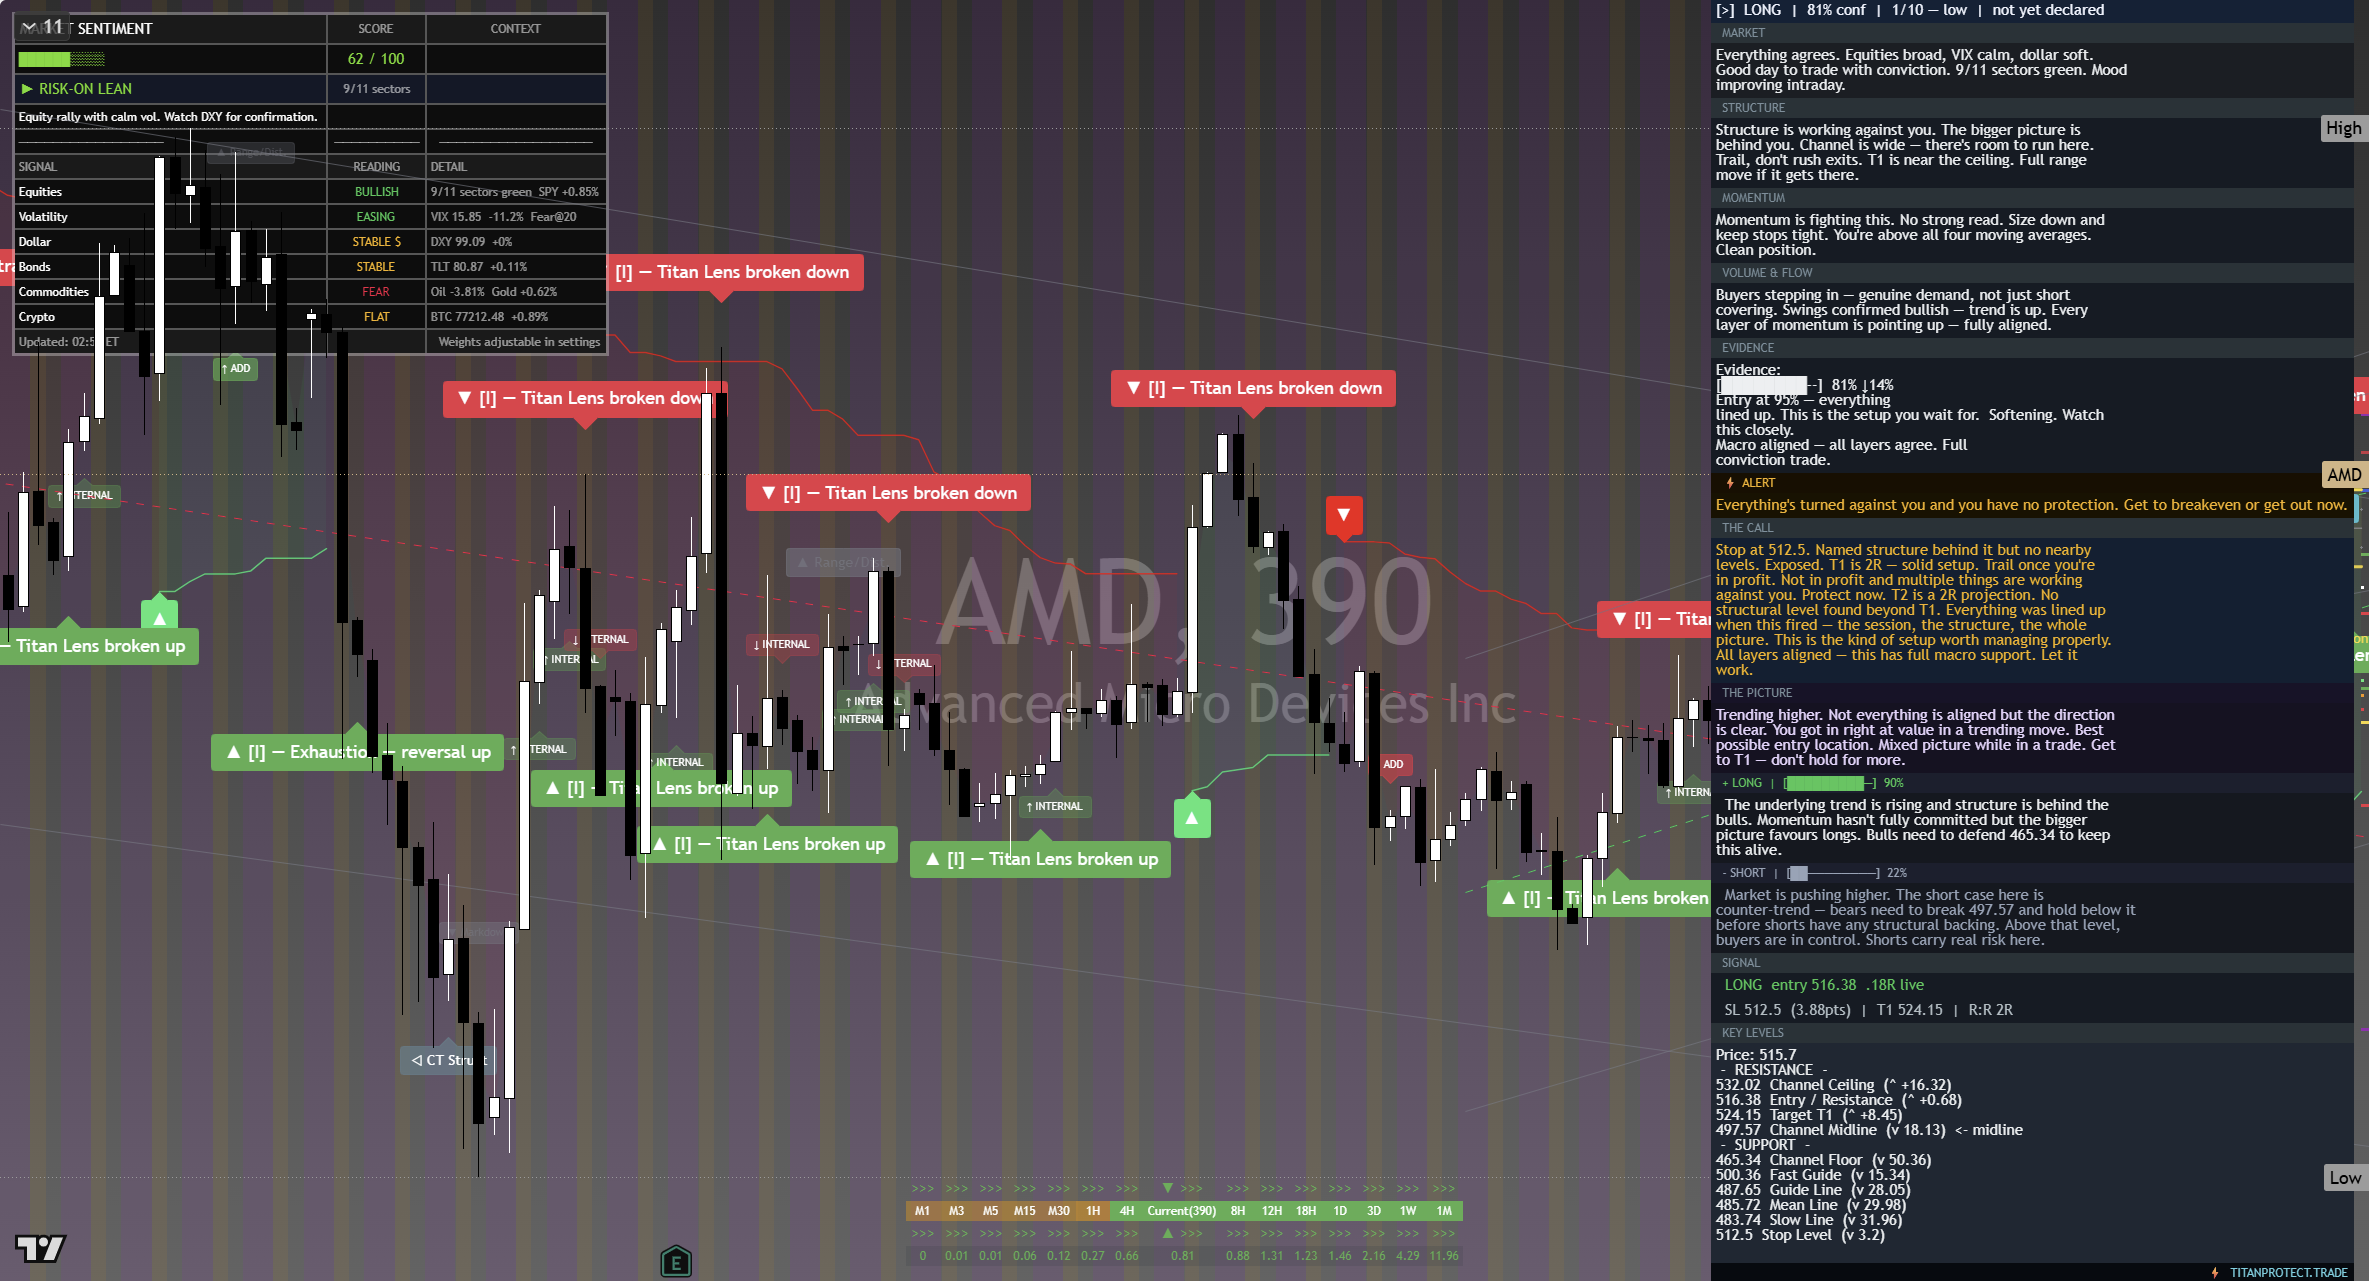
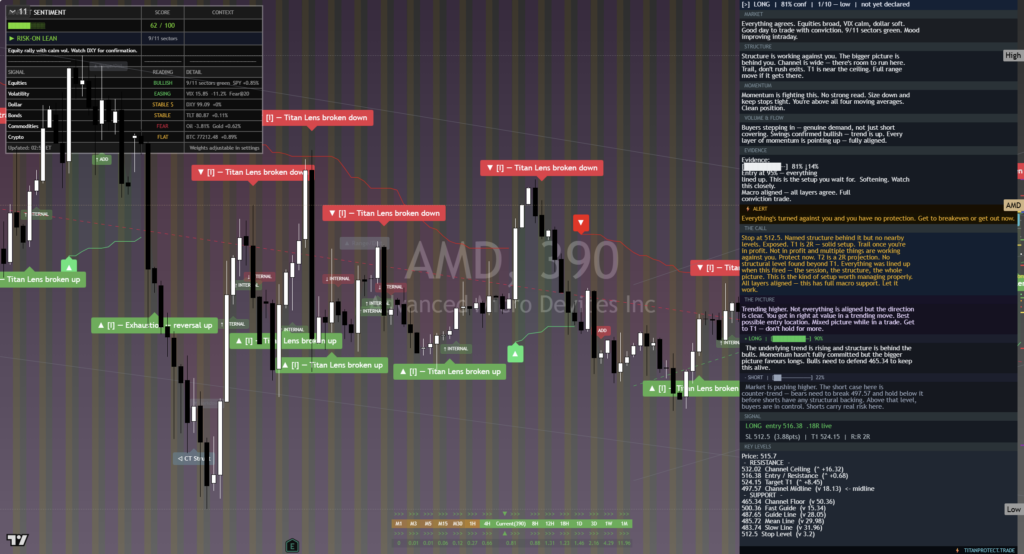
The chart above is the full daily read: structure, momentum, the levels that matter, and where the current price sits against them. Read it top to bottom for the complete picture, and pair it with our session briefs for the wider market context.
This is analysis, not financial advice. It reflects our multi-factor framework and is not a recommendation to buy or sell. Always do your own research and manage your risk.