AMD – Daily Read
6 September 2026 | Stock | Titan Macro Desk
$477.57
AMD is attempting to reestablish an upward structure, with the last price at $477.57, 4.7 percent higher on the day. The move matters because it has restored some control to buyers without yet proving that the broader correction is finished. It is sitting mid-range over the past month, so this is neither a washed out entry point nor a confirmed breakout. The clear view is constructive while price holds its recovered ground, but conviction should remain conditional until the market absorbs overhead supply.
The macro backdrop is a contest between confidence in durable technology spending and sensitivity to rates, growth expectations, and broader risk appetite. AMD sits directly in that tension. Its valuation depends on continued demand for high performance computing and artificial intelligence infrastructure, while the stock also carries the higher volatility typical of the semiconductor asset class. Company execution, competitive positioning, customer adoption, and the durability of data center spending therefore matter more than a broad index tailwind alone. Momentum roughly 0.9 percent up over the last two weeks supports the recovery narrative, although it does not yet describe an impulsive trend.
The one month average is $475.15; price is above it, and the structure reads as a recovery attempt, back above the one-month average but still under the longer one. That makes the current area an important test of whether buyers can convert a rebound into sustained control. The nearer round number handles at $480.00 and $470.00 frame the immediate battle. Holding above $480.00 would show acceptance at higher prices and improve the quality of the advance, while slipping through $470.00 would suggest that the latest push is losing sponsorship. The month swing high is $517.30, about 8.3 percent above the current price. It matters because sellers previously asserted control there, so a decisive move through it would remove a visible supply barrier. A shelf of support at $440.50, about 7.8 percent below, is the key defensive line because it anchors the recovery. The three month range is $286.14 to $574.20, showing both the upside room and the severity of downside if support fails.
The bull path is straightforward: if AMD holds the recovered average, establishes acceptance above $480.00, and then sustains buying through the month swing high, a decisive move above $517.30 opens the path toward $574.20. That sequence would indicate that overhead supply has been absorbed and that the broader range is resolving upward. The bear path begins if $480.00 repeatedly rejects price and $470.00 gives way. If selling then drives through the support shelf, losing $440.50 exposes $286.14, because the present recovery structure would be broken and the lower boundary of the wider range would become relevant.
The main risk to the constructive view is a reversal in semiconductor sentiment, weaker confidence in infrastructure demand, or an adverse shift in the macro environment that compresses appetite for expensive growth. The read is invalidated by a sustained loss of $440.50, while failure to clear $517.30 would keep AMD range bound rather than outright bearish. Net, the setup favors buyers tactically, but the decisive confirmation still sits overhead.
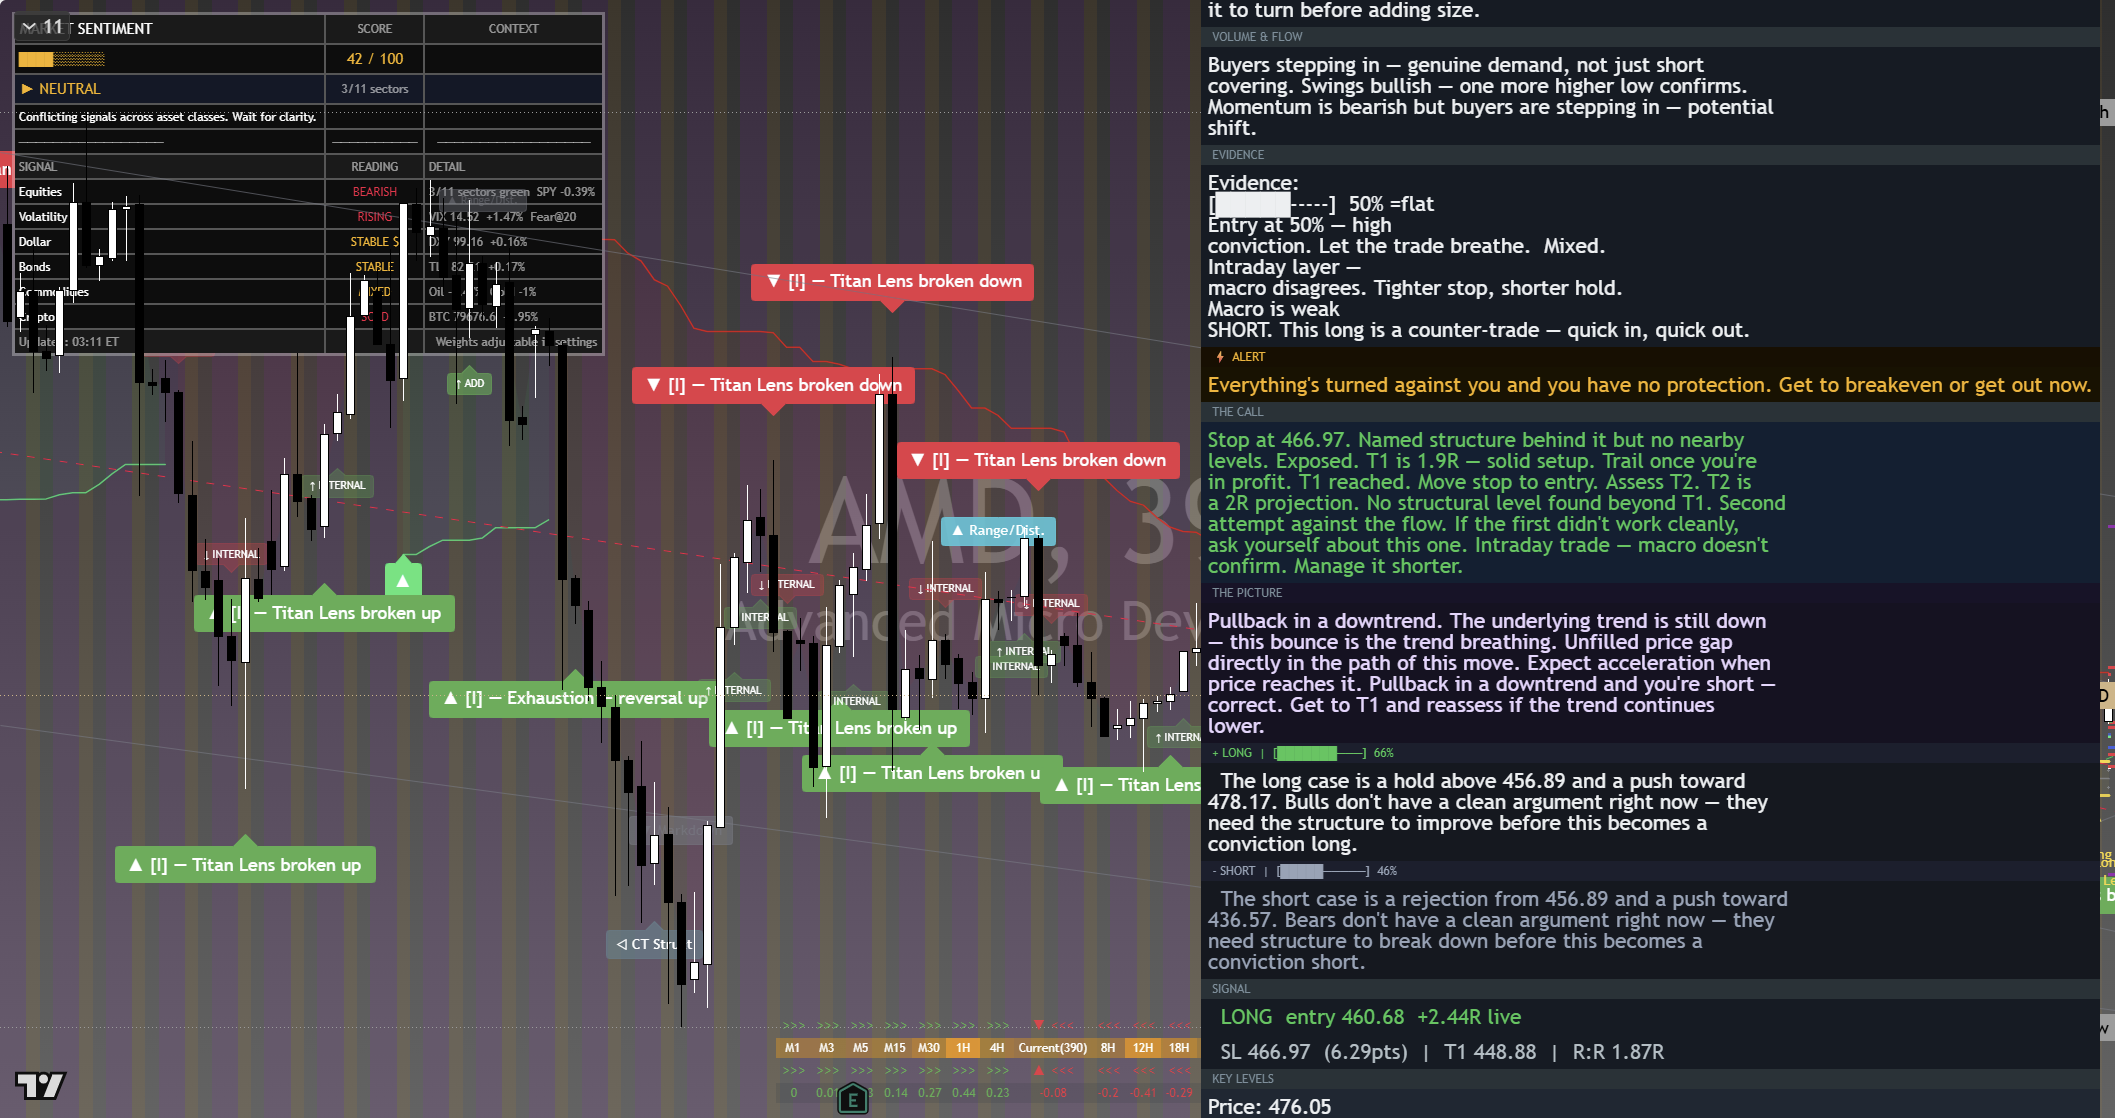
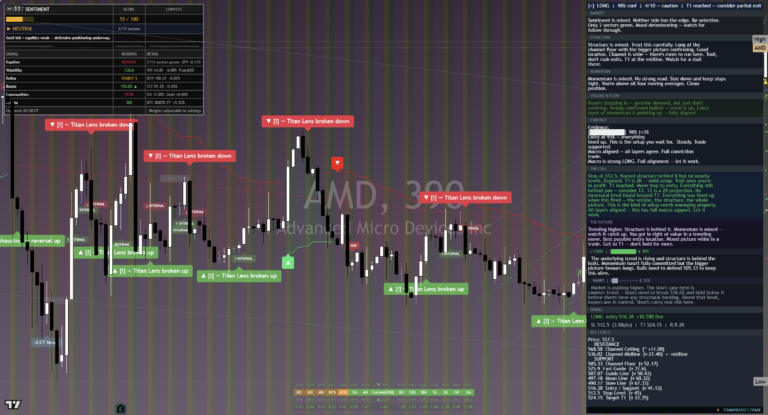
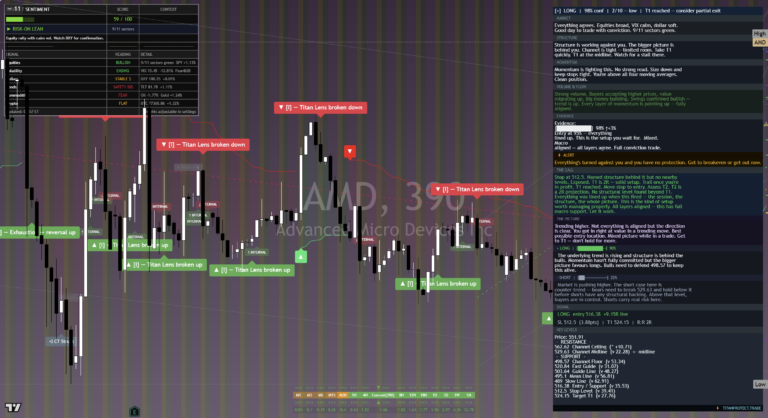
The chart above is the full daily read: structure, momentum, the levels that matter, and where the current price sits against them. Read it top to bottom for the complete picture, and pair it with our session briefs for the wider market context.
This is analysis, not financial advice. It reflects our multi-factor framework and is not a recommendation to buy or sell. Always do your own research and manage your risk.