AMD – Daily Read
2 September 2026 | Stock | Titan Macro Desk
$459.61
AMD is under clear near-term pressure, and the key issue is whether sellers are completing a controlled pullback or starting a much deeper repricing. The last price is $459.61, 2.4 percent lower on the day, leaving the stock down near the floor of its one-month range. That matters because weakness is no longer confined to an isolated session. Momentum is roughly 4.9 percent down over the last two weeks, while the structure reads as a downtrend, price under both its one-month and longer averages. The burden of proof therefore sits with buyers.
The broader backdrop remains important because AMD trades as both a company-specific growth stock and a high-beta expression of semiconductor demand. Expectations around artificial intelligence spending, data-center investment, competitive execution, interest rates, and the general appetite for long-duration growth can all amplify moves. With no specific corporate catalyst supplied here, the cleanest interpretation is that positioning and risk appetite are pressing an already weakened structure. The one month average at $478.35 now acts as an overhead reference. Price is below it, so rallies into that area are likely to meet holders looking to reduce exposure unless demand arrives with greater conviction.
The immediate battle is around the nearer round number handles at $460.00 and $450.00. The $460.00 area matters because the stock is sitting almost directly on it, making it a practical test of whether buyers can absorb current selling. Below there, $450.00 adds a visible psychological reference, but the more consequential shelf of support is $451.18, about 1.8 percent below. That shelf is the line buyers must defend to keep the decline contained near the bottom of the recent range. A clean loss would signal that support has failed rather than merely been tested. Overhead, the month swing high at $530.13, about 15.3 percent above the current price, is the level that would overturn the present sequence of weakness. The wider three month range is $272.13 to $574.20, showing that both recovery potential and downside air remain unusually large.
The bull path is straightforward: if AMD holds $451.18, reclaims $460.00, and then establishes acceptance above the one month average at $478.35, then the current decline can begin to look like exhaustion near range support. If buyers subsequently force a decisive move above $530.13, that confirms a meaningful change in control and opens the path toward $574.20. The bear path is equally clear: if rebounds fail beneath $478.35 and sellers push through $451.18 and $450.00, then the recent floor has broken. Losing $451.18 exposes $272.13, with the breadth of that downside reflecting the lack of supplied structural support between those boundaries.
The main risk to the bearish read is a forceful recovery through $478.35 that holds, because that would show sellers can no longer control rallies. Full invalidation comes with a decisive move above $530.13. Conversely, defending $460.00 briefly does not repair the structure if price remains below its averages. Net, AMD is tactically bearish near important support: buyers have a defined place to respond, but until they reclaim overhead territory, strength is more likely to be challenged than trusted.
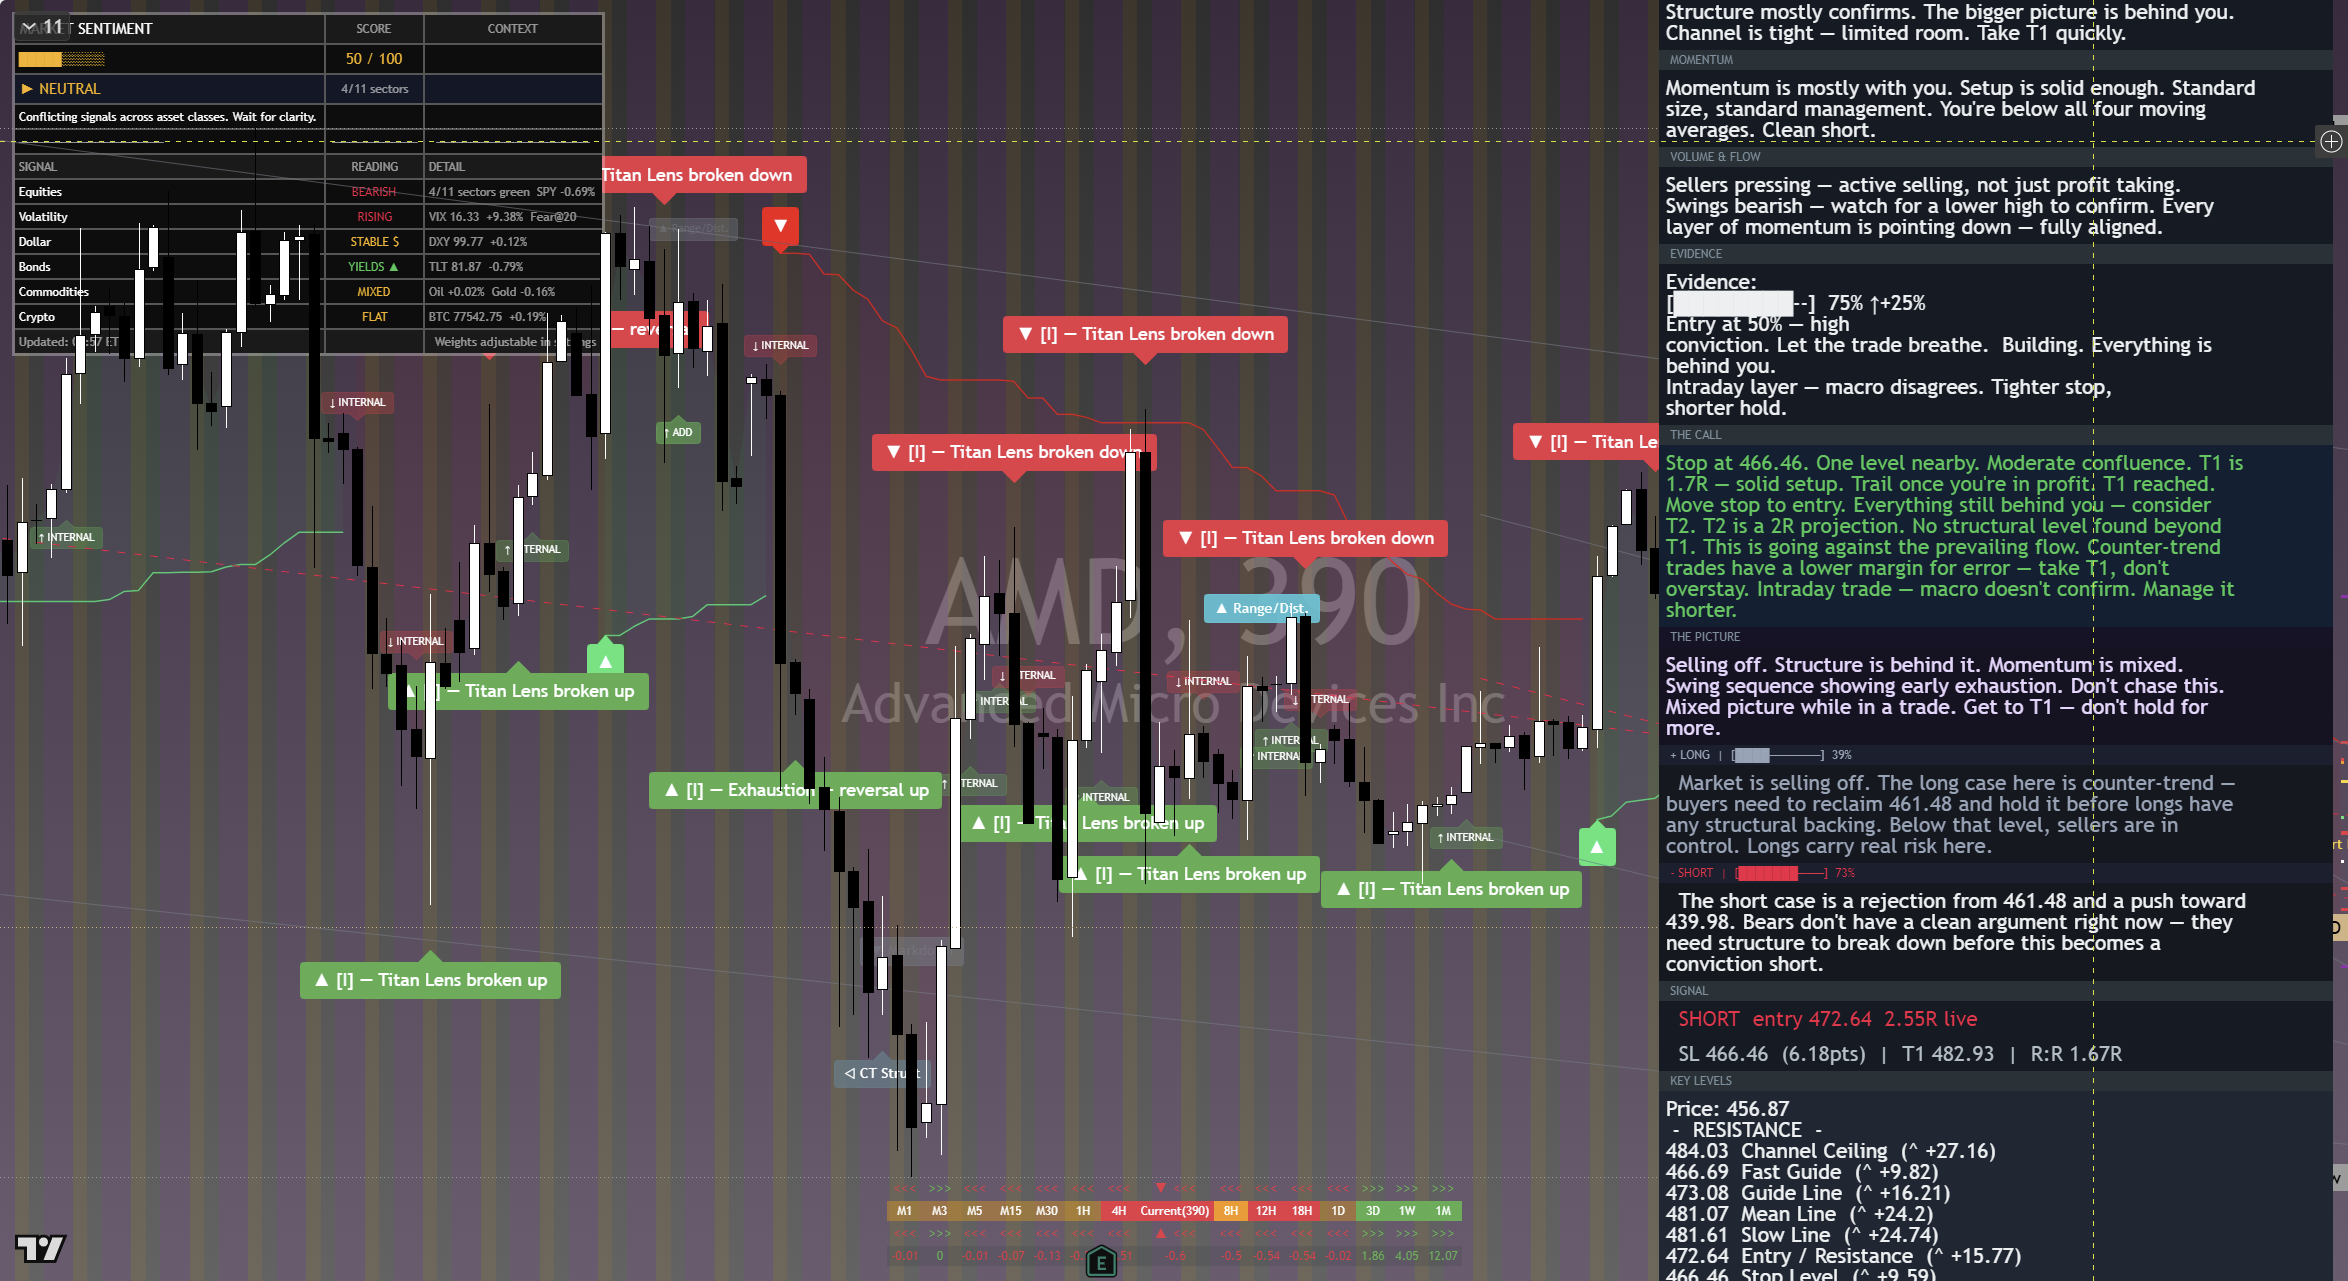
The chart above is the full daily read: structure, momentum, the levels that matter, and where the current price sits against them. Read it top to bottom for the complete picture, and pair it with our session briefs for the wider market context.
This is analysis, not financial advice. It reflects our multi-factor framework and is not a recommendation to buy or sell. Always do your own research and manage your risk.