Amazon (AMZN) – Daily Read
10 September 2026 | Stock | Titan Macro Desk
$252.40
Amazon is under near-term pressure, but the larger structure has not yet turned bearish. Last price $252.40, 1.8 percent lower on the day. The stock is down near the floor of its one-month range, where sellers have control of the immediate tape but are also approaching an area that should attract a more serious response from buyers. The clear view is cautious near term and constructive beyond it: weakness can still resolve as a healthy pullback, but the market must defend nearby support before confidence in the longer uptrend can rebuild.
The broader backdrop is one in which large growth stocks remain sensitive to changes in interest-rate expectations, risk appetite, consumer resilience, and confidence in future corporate spending. Amazon carries additional exposure to the quality of discretionary demand, retail margins, cloud activity, and expectations around investment intensity. That combination matters because investors can support the long-term growth case while still reducing exposure when valuation tolerance narrows. Momentum roughly 3.3 percent down over the last two weeks confirms that this is more than an isolated weak session. The one month average $260.16 sits above price, and the structure reads as a pullback, slipping under the one-month average while the longer trend still points up. Recovering that average would suggest sellers are losing control. Remaining below it would keep rallies vulnerable to renewed supply.
The nearer round number handles at $255.00 and $250.00 frame the immediate battle. The first is the level buyers need to reclaim to steady sentiment and begin repairing the latest damage. The second carries psychological importance and sits close to a shelf of support at $250.65, about 0.7 percent below. That shelf is the key near-term defense because it separates an orderly retracement from a deeper unwind. The month swing high $280.14, about 11.0 percent above the current price, is the major upside barrier and the point where the market would demonstrate that the pullback has been fully absorbed. The three month range $226.12 to $287.16 defines the wider map, with the lower boundary representing the next meaningful downside reference and the upper boundary marking unfinished upside business.
The bull path is straightforward: if Amazon holds $250.65, regains $255.00, and then establishes acceptance above $260.16, buyers can argue that the decline exhausted near support rather than beginning a trend reversal. In that case, attention returns to $280.14. A decisive move above $280.14 opens the path toward $287.16, where supply from the top of the broader range should provide the next test. The bear path begins if attempts to regain $255.00 fail and selling drives through $250.00. Losing $250.65 exposes $226.12, because the failure of the support shelf would leave limited structural protection before the bottom of the wider range.
The principal risk to the constructive view is that company-specific expectations weaken while the broader market becomes less willing to pay for long-duration growth. A sustained failure below $250.65 would invalidate the idea that this is merely a contained pullback. Conversely, a recovery above $260.16 would weaken the bearish case, while clearance of $280.14 would invalidate it more decisively. Net, Amazon remains a longer-trend leader under tactical pressure, with $250.65 serving as the line between a defendable reset and a materially deeper correction.
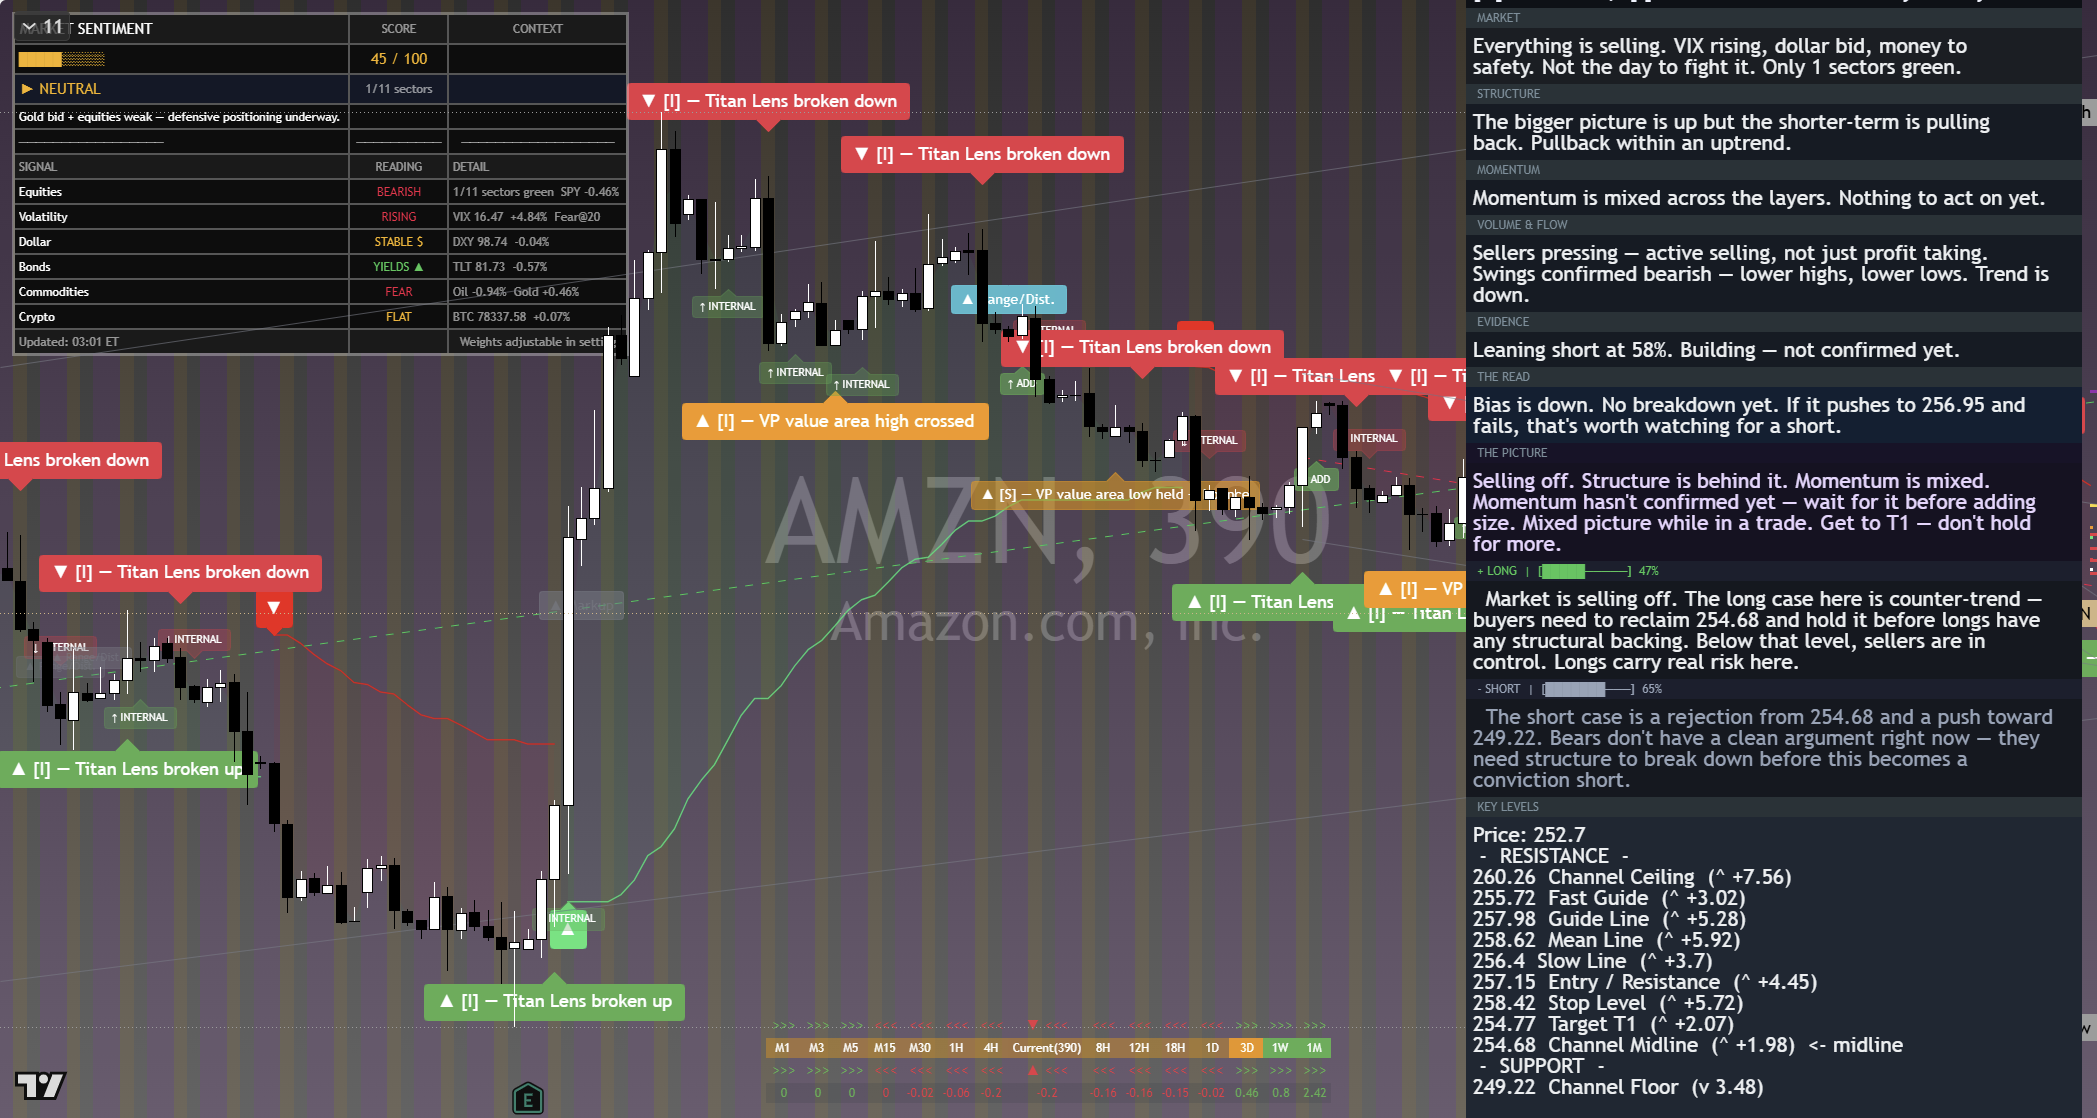
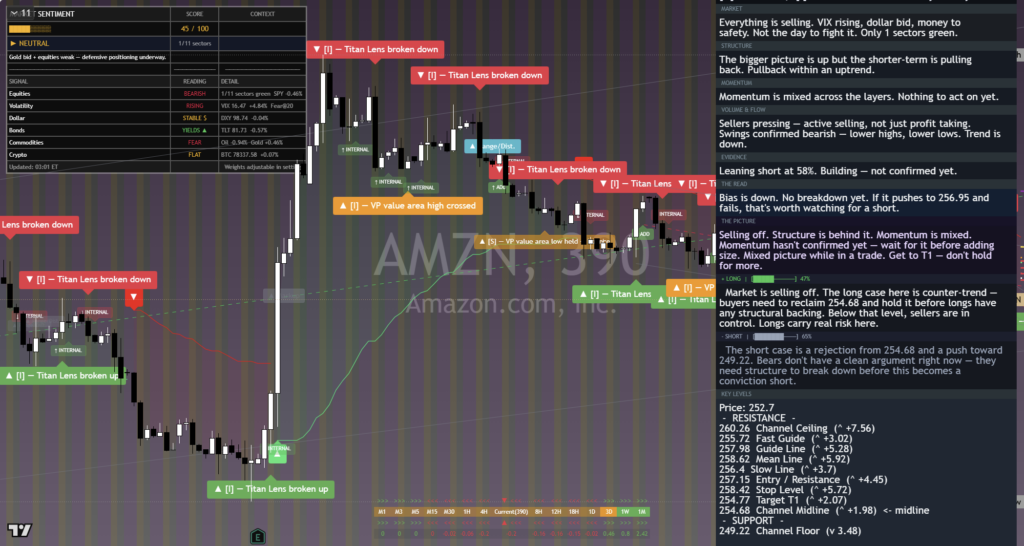
The chart above is the full daily read: structure, momentum, the levels that matter, and where the current price sits against them. Read it top to bottom for the complete picture, and pair it with our session briefs for the wider market context.
This is analysis, not financial advice. It reflects our multi-factor framework and is not a recommendation to buy or sell. Always do your own research and manage your risk.