Amazon (AMZN) – Daily Read
7 September 2026 | Stock | Titan Macro Desk
$258.51
Amazon is consolidating within a longer-term advance, but buyers have yet to regain near-term control. The last price is $258.51, 0.2 percent lower on the day, leaving the stock in the lower half of its one-month range. The key tension is between a still-rising broader structure and a pullback that has not generated fresh momentum. That matters because Amazon now sits close enough to support for buyers to defend the trend, yet far enough below the recent peak that a convincing recovery still requires meaningful work. The near-term view is cautiously constructive while support holds, but conviction should remain measured until price recaptures nearby resistance.
The macro backdrop is one in which expectations around growth, consumer resilience, corporate spending, and the cost of capital remain central to large-cap technology valuations. Amazon carries exposure to several of those forces through online demand, cloud investment, advertising activity, and expectations for operating leverage. Its one month average is $262.21; price is below it, and the structure reads as a pullback, slipping under the one-month average while the longer trend still points up. Momentum is roughly 0.0 percent down over the last two weeks, which signals hesitation rather than outright deterioration. Sellers have slowed the advance, but they have not yet established a forceful downside impulse.
The nearer round number handles at $260.00 and $255.00 frame the immediate contest. Holding above $255.00 would show that buyers are willing to absorb weakness near the current area, while reclaiming $260.00 would begin repairing the short-term tone and put the one month average back within reach. The more important shelf of support is at $251.93, about 2.5 percent below. It is the level that defends the pullback interpretation because weakness above it can still be treated as consolidation within the broader rise. A sustained break would signal that supply is no longer being contained. On the upside, the month swing high is $280.14, about 8.4 percent above the current price. That is the clearest barrier separating recovery from renewed expansion. The three month range is $226.12 to $287.16, defining both the deeper downside reference and the next upside objective.
The bull path is straightforward: if Amazon stabilizes above $255.00, reclaims $260.00, and then moves back above $262.21, the pullback should begin to lose credibility and buyers can press toward $280.14. If demand then produces a decisive move above $280.14, it opens the path toward $287.16, with the breakout confirming that the longer trend has regained authority. The bear path begins if attempts to recover $260.00 repeatedly fail. If that rejection pushes price through $255.00 and selling then removes $251.93, the pullback becomes a more material breakdown. Losing $251.93 exposes $226.12, because the market would have surrendered its principal nearby defense and reopened the wider range.
The main risk to the constructive view is persistent weakness in growth-sensitive equities or an Amazon-specific deterioration in expectations around demand, cloud spending, margins, or investment intensity. The read is invalidated on the bullish side by a clear loss of $251.93, while the bearish case is invalidated by sustained acceptance above $280.14. Net, Amazon remains a longer-trend winner undergoing a hesitant pullback, with support still close enough to favor patience but resistance strong enough to demand confirmation.
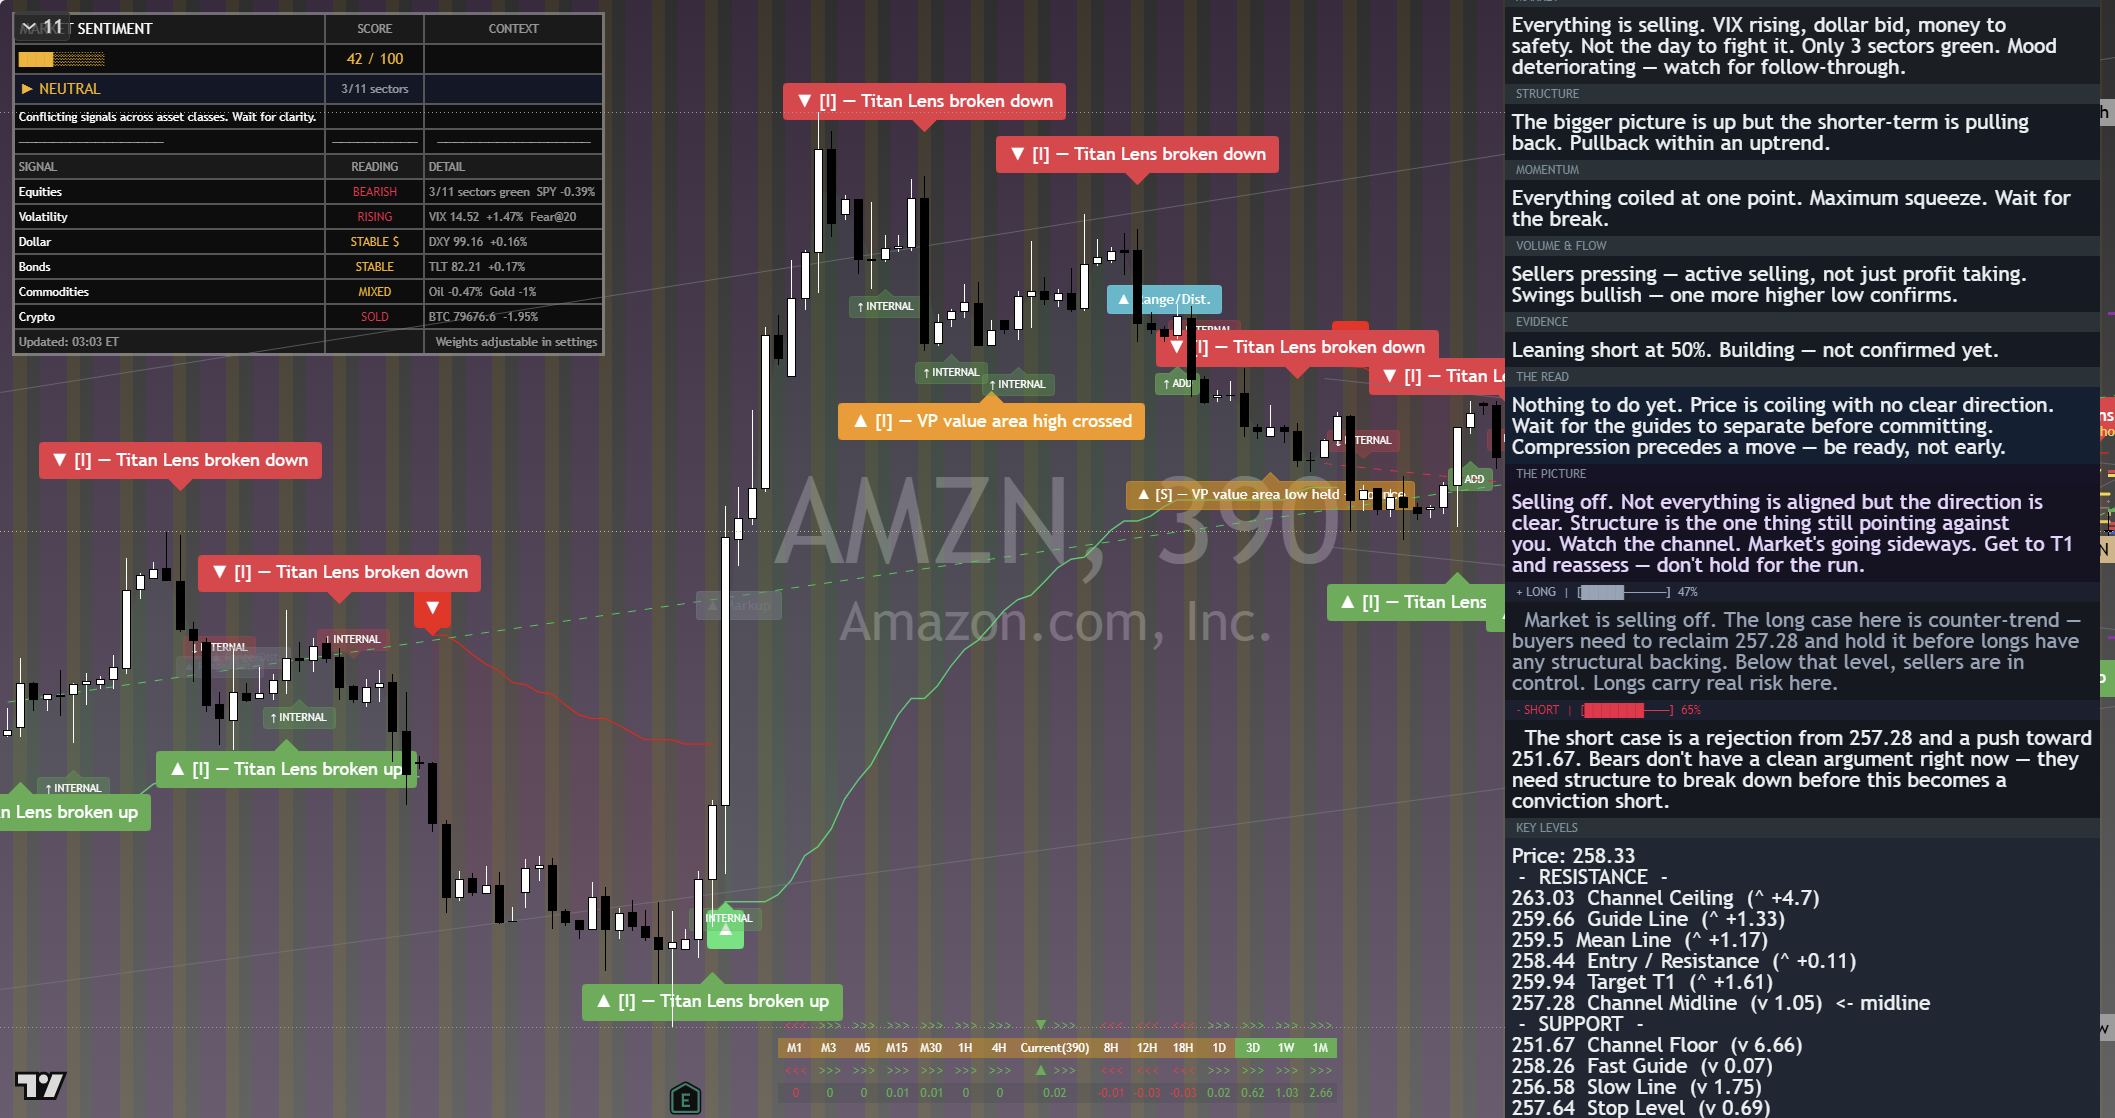
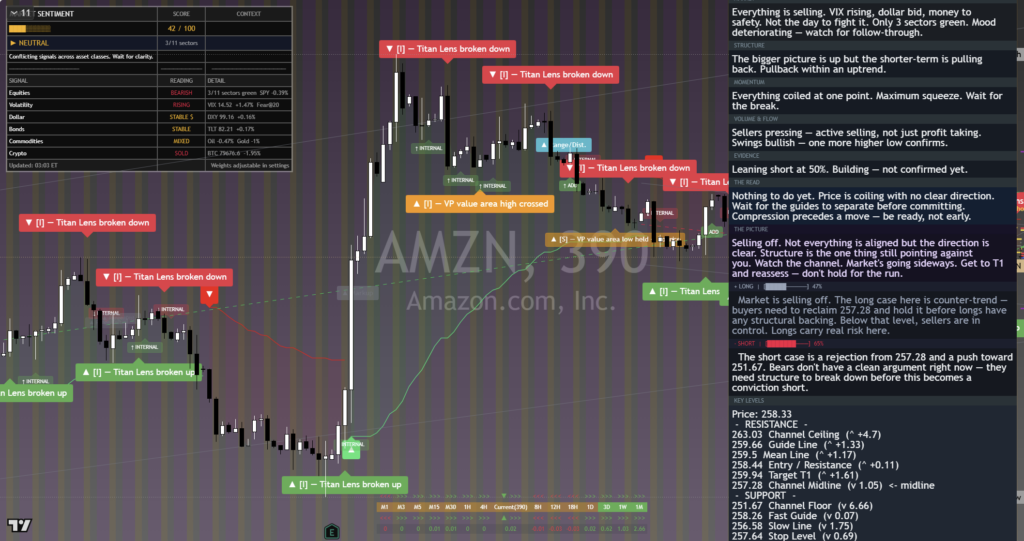
The chart above is the full daily read: structure, momentum, the levels that matter, and where the current price sits against them. Read it top to bottom for the complete picture, and pair it with our session briefs for the wider market context.
This is analysis, not financial advice. It reflects our multi-factor framework and is not a recommendation to buy or sell. Always do your own research and manage your risk.



