Amazon (AMZN) – Daily Read
2 September 2026 | Stock | Titan Macro Desk
$254.92
Amazon is correcting within an intact longer-term advance, but the burden of proof has shifted to buyers. Last price $254.92, 1.9 percent lower on the day. It is down near the floor of its one-month range, making this a decision area rather than an attractive place for complacency. The clear view is cautiously constructive above support, but the stock must reclaim nearby resistance before the pullback can be treated as complete.
The macro backdrop is doing much of the immediate damage. Higher oil prices, rising bond yields, and renewed geopolitical stress have encouraged a broader retreat from growth stocks, with large technology companies carrying much of the pressure. That matters for Amazon because a higher-rate environment challenges the valuation of long-duration growth while also sharpening scrutiny of heavy infrastructure spending. Against that pressure, the company-specific argument remains its mix of cloud growth, advertising, retail efficiency, and artificial-intelligence investment. The latest decline therefore looks partly like asset-class de-risking, although buyers still need to prove that the fundamental story can absorb the tougher market regime. [Associated Press](https://apnews.com/article/775d7cf741349c7c8e689c0beb57f074)
The one month average $264.56 sits above price, and the structure reads as a pullback, slipping under the one-month average while the longer trend still points up. That average now matters as a recovery test: reclaiming it would suggest supply is being absorbed, while repeated rejection would confirm that rallies are being sold. Momentum roughly 1.8 percent down over the last two weeks reinforces the loss of near-term control. The nearer round number handles at $255.00 and $250.00 frame the immediate contest. Holding around $255.00 would show buyers stabilising the tape, while $250.00 is the psychological line where hesitation could become forced selling. A shelf of support at $251.93, about 1.2 percent below, is the more important defence because it separates an orderly reset from a deeper structural retracement.
The Three month range $226.12 to $287.16 shows that the stock remains well above its broader floor but has surrendered meaningful ground from the upper boundary. The Month swing high $287.16, about 12.6 percent above the current price, is not merely an upside reference. It marks where sellers last overwhelmed demand, so clearing it would confirm renewed price acceptance at the top of the range. If buyers defend $251.93, recover $255.00, and then establish price above the one month average $264.56, the bull path becomes a retest of the high. A decisive move above $287.16 opens the path toward $292.16. If $255.00 remains resistance and selling pushes through $251.93 and $250.00, the bear path gains control. Losing $251.93 exposes $226.12.
The main risk to the constructive read is continued pressure from yields, energy costs, and broad technology de-risking, especially if company investment is viewed as outrunning near-term returns. A clean loss of $251.93 would invalidate the idea that this is only a contained pullback. Conversely, sustained recovery above $264.56 would weaken the bearish case. Net, Amazon is at support with its longer trend alive, but confirmation belongs to buyers, not to hope.
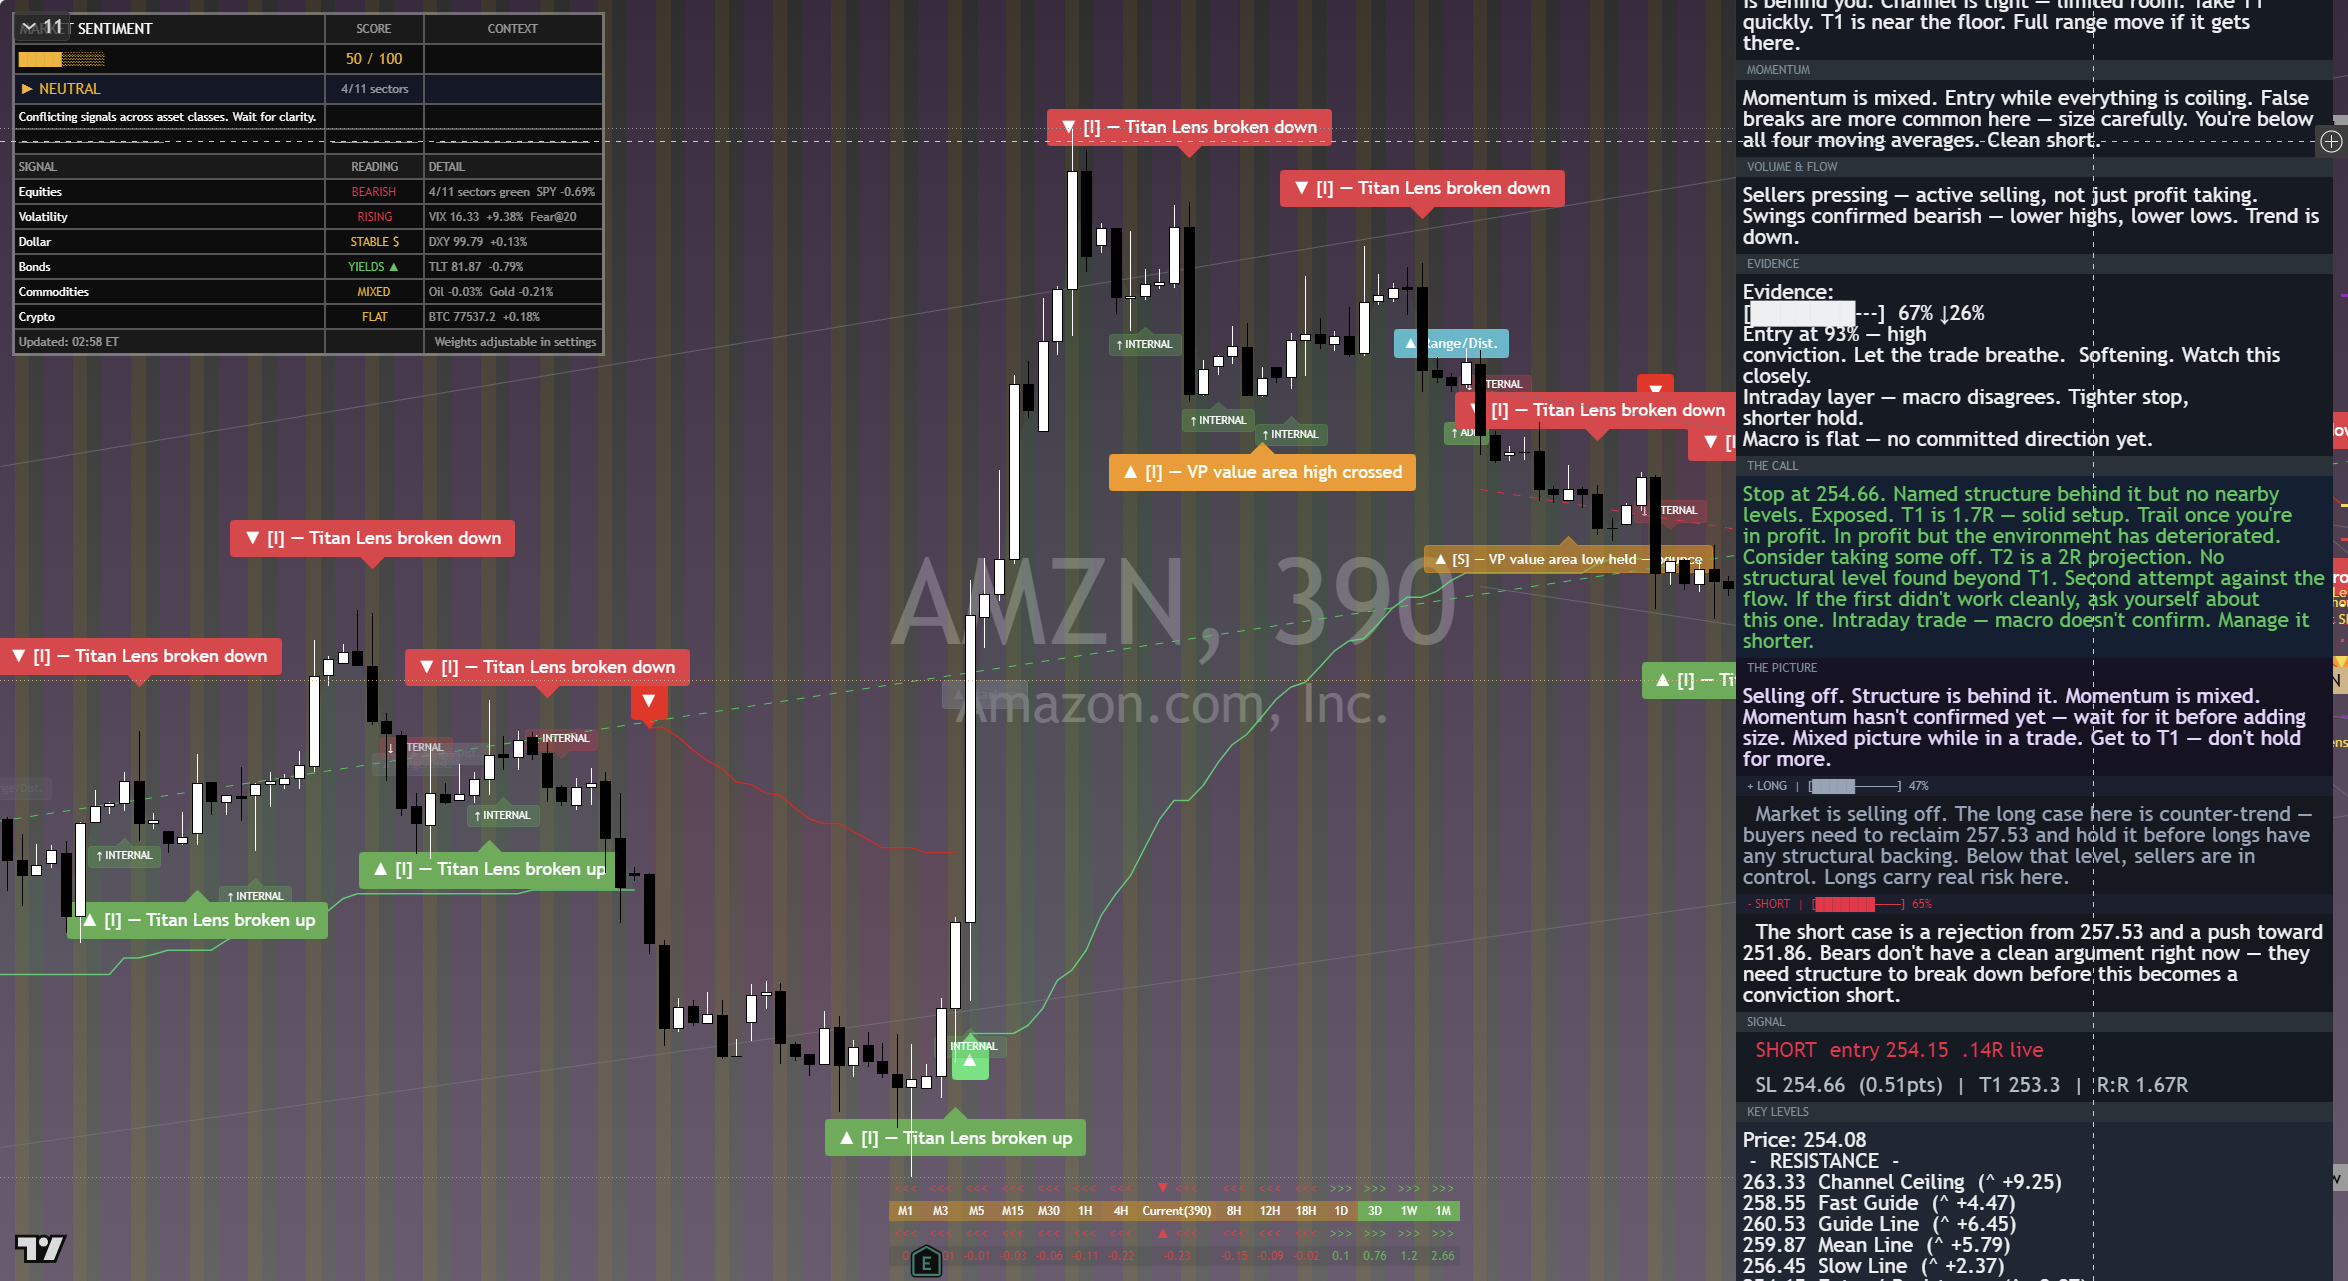
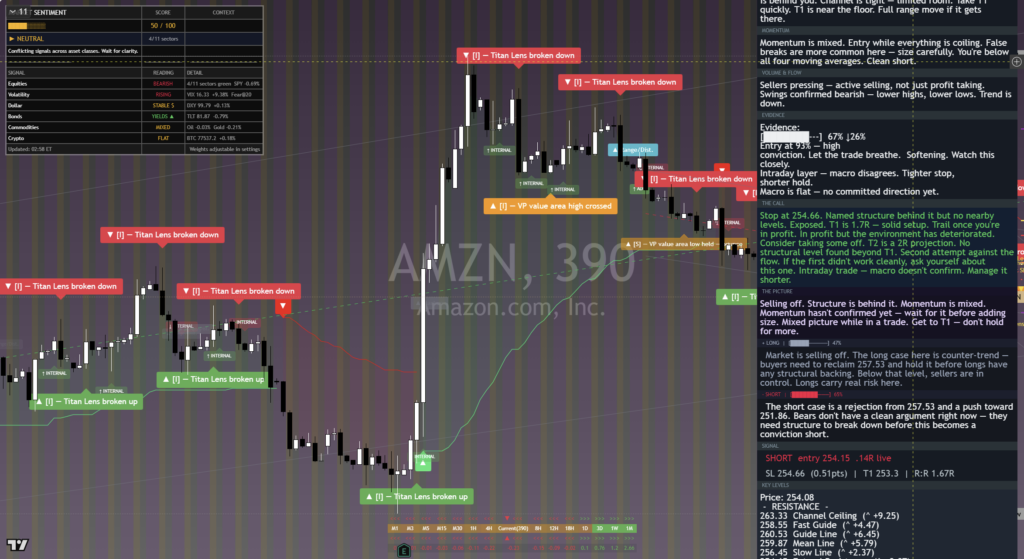
The chart above is the full daily read: structure, momentum, the levels that matter, and where the current price sits against them. Read it top to bottom for the complete picture, and pair it with our session briefs for the wider market context.
This is analysis, not financial advice. It reflects our multi-factor framework and is not a recommendation to buy or sell. Always do your own research and manage your risk.