Trader Mindset Series
The trades you take in the first hour are only as good as the preparation you did before the market opened.
Prep Matters More Than the Trade
Walk into any institutional trading floor before the open and you will not see traders chatting or scrolling news feeds. You will see them working. Reviewing overnight price action, marking levels, checking the calendar, building a view for the session ahead. The work happens before the bell, not after it.
For retail traders, this habit is often the biggest gap between those who improve consistently and those who stay stuck. It is easy to sit down at 8am, open a chart, see price moving, and jump in based on a feeling about direction. Sometimes that works. Over a hundred trades, it does not build an edge.
The pre-market routine is the process that puts you in the right position to make good decisions when price actually moves. It is not glamorous. It does not guarantee profits. But without it, you are reacting rather than executing.
What Happened While You Were Asleep
If you are trading European or US markets, overnight price action in Asia and the futures market tells you a great deal before your session begins. You want to know: did price break any significant levels overnight, where did it open relative to yesterday’s close, and is there a clear directional bias coming into the session open?
This does not require reading twenty news articles. It requires looking at the overnight chart of your instruments and asking three questions: where did we close yesterday, where are we now, and what happened in between?
If the S&P 500 futures gapped down overnight and held below a key structural support, that tells you the session is likely to open with bearish pressure. If the Nasdaq futures recovered through the overnight low and pushed back toward yesterday’s close, the sellers may have lost their conviction. Either way, you have context. Context means better decisions.
The Economic Calendar
The economic calendar is non-negotiable. High-impact events change the rules of engagement. On a day with a Federal Reserve rate decision at 19:00 UK time, the afternoon session will be volatile and unpredictable in the two hours before the announcement. Spreads widen, stops get hunted, and positions held through the release are subject to gaps that make stop losses less effective.
Know the events for the day and what time they land. Flag which instruments they will impact most directly. Decide in advance whether you will trade around them or go flat beforehand. This is a decision made calmly in the pre-market, not under pressure with a trade open and a release 90 seconds away.
The same logic applies to earnings season. If you trade individual equities or sector indices, knowing that major tech earnings drop after the US close can save you from holding positions through a 5% gap overnight with no protection.
Key Levels From Yesterday
The market has a memory. Yesterday’s high, low, and close are reference points that institutional participants use, and where price often finds reaction. The prior day high on the Nasdaq is not arbitrary. It represents a level where sellers were active enough to turn price around. If price attempts that level again today, there is a reason to pay attention.
In your pre-market prep, mark the following on your charts before the session begins: prior day high and low, prior day close, the weekly open, any clear consolidation zones from the last two to three sessions, and any major round numbers nearby (for index futures, these often land every 100 to 200 points and act as magnets).
You are not marking every single line visible on the chart. You are identifying the four or five levels where price is most likely to react today. Quality over quantity.
Market Structure Assessment
Before you trade any instrument today, look at the daily and 4-hour chart and answer: what is the current structure? Is the instrument in an uptrend, downtrend, or consolidation on the higher timeframe?
This matters because it filters your session setups. If the daily chart on the FTSE 100 is in a clear downtrend, short setups on the intraday chart have the wind behind them. Longs are fighting the structure. You can still take longs in the right circumstances, but you should be more selective and quicker to take profit.
The structure assessment takes about two minutes per instrument if you do it regularly. It keeps you aligned with the dominant directional pressure rather than fighting moves that are technically predictable from the higher timeframe.
Instrument Selection for the Session
Not every instrument will have a clear setup every day. Part of professional pre-market work is deciding which one or two instruments have the cleanest potential for your style today, and leaving the others alone.
A trader who always forces trades on the same instrument regardless of conditions will have much worse results than one who identifies the two instruments with the clearest structure and focuses there. Gold might have a clear range compression worth watching. The Nasdaq might be in no-man’s land between levels. Cable might have a key economic release at noon. This context shapes which market gets your attention.
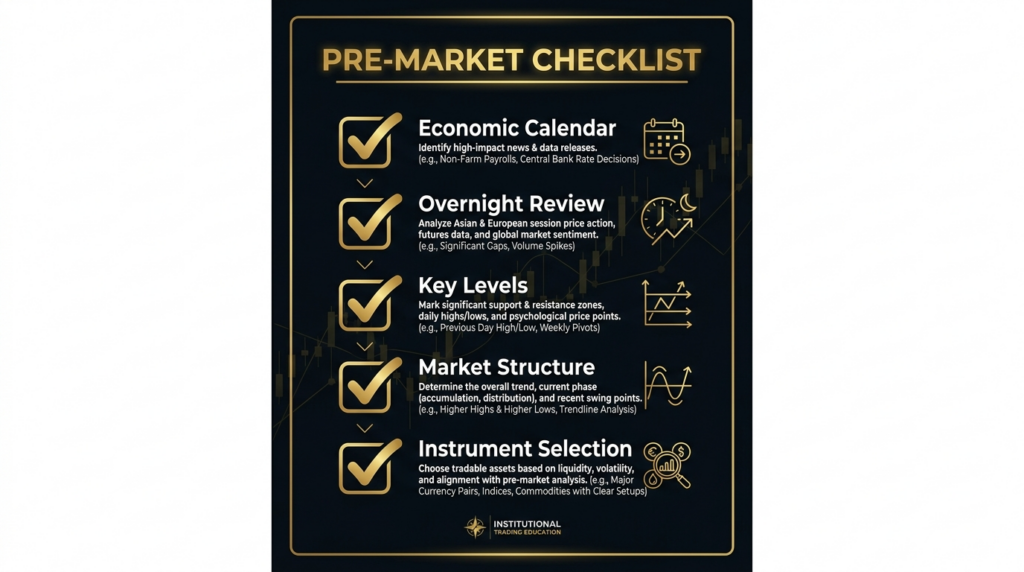
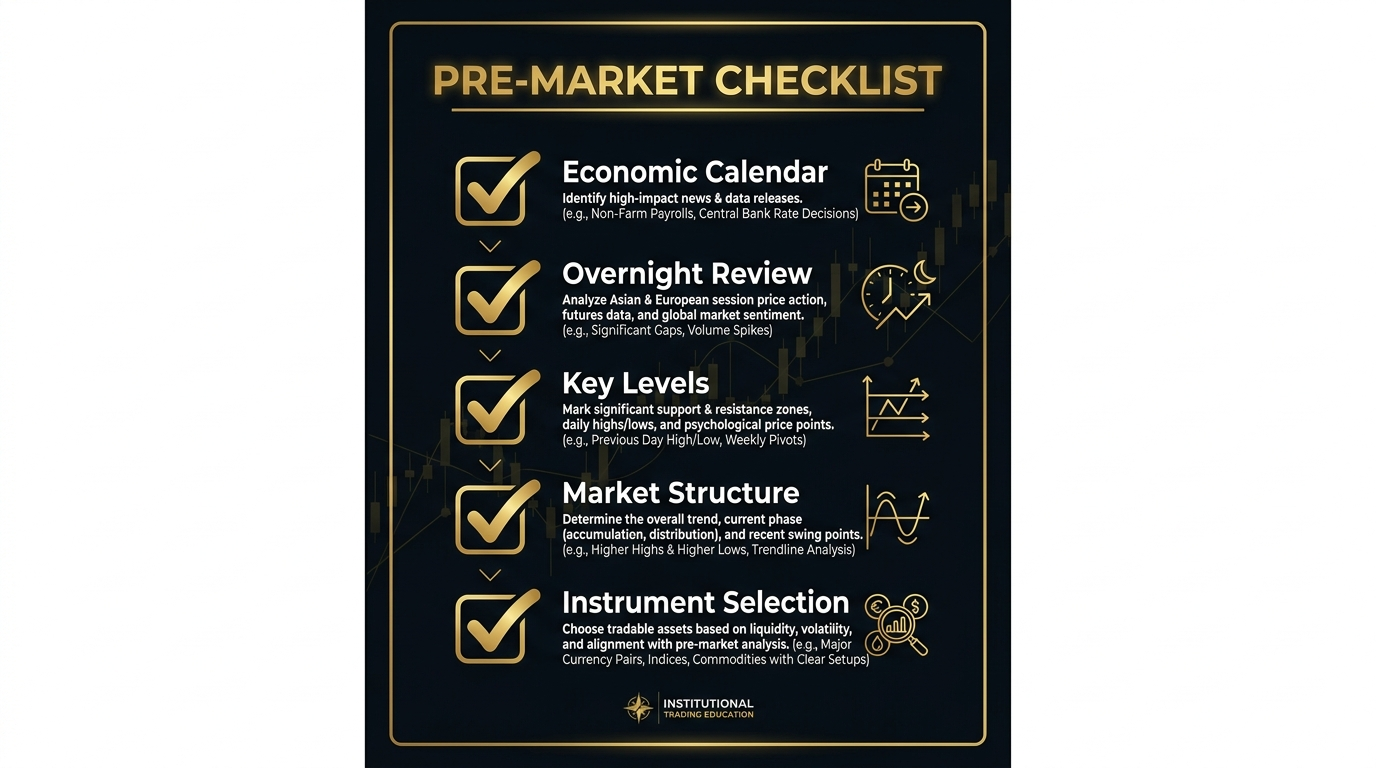
The 15-Minute Pre-Market Checklist
The full routine above does not need to take more than 15 focused minutes. The table below shows a structured sequence that covers all five elements.
| # | Task | What You Are Looking For | Time |
|---|---|---|---|
| 1 | Overnight recap | Gap vs prior close, key level breaks, directional bias | 3 mins |
| 2 | Economic calendar | High-impact events, times, affected instruments | 2 mins |
| 3 | Key levels on chart | PDH, PDL, weekly open, consolidation zones, round numbers | 4 mins |
| 4 | Market structure (daily + 4H) | Trend direction, bias for session, filter for longs vs shorts | 3 mins |
| 5 | Session plan and instrument pick | Which 1-2 instruments, what scenarios, what criteria to trade | 3 mins |
The session plan does not need to be an essay. Two or three sentences per instrument: where price is, what would make you go long, what would make you go short, and what would make you stay out. Written plans force clarity. They also give you something to review after the session, which is where the learning compounds.
The Discipline to Skip the Open
One underrated part of the pre-market routine is the decision to watch the first 15 minutes of the session rather than trade them. The first 15 minutes of the London open and the New York open are where retail stops are most frequently hunted, where fakeouts are most common, and where the day’s range often prints its extremes before settling.
Waiting 15 minutes after the open to see which direction has conviction is not missing opportunity. It is choosing better opportunity. The high-probability setups often come in the second and third hour of the session, after the noise has resolved and the genuine directional move becomes clear.
Build the 15-minute observation period into your routine. It will save you from more bad trades than almost any indicator you can add to your chart.
Action Items
- Run the 15-minute checklist every day for the next two weeks before touching a chart to trade. Time it. Make it a habit.
- Before your next three sessions, write a two-sentence session plan per instrument. After the session, check whether price followed your scenarios or created entirely different ones.
- Add a 15-minute observation window at the open to your routine. No trades until you have watched price reveal its hand.
- Pick one high-impact economic event this week and decide in advance whether you trade around it or go flat 30 minutes before the release.
Continue Learning
Trader Mindset Series
← Knowing Your Trading Style
Trader Mindset Series
How to Build a Trading Routine →