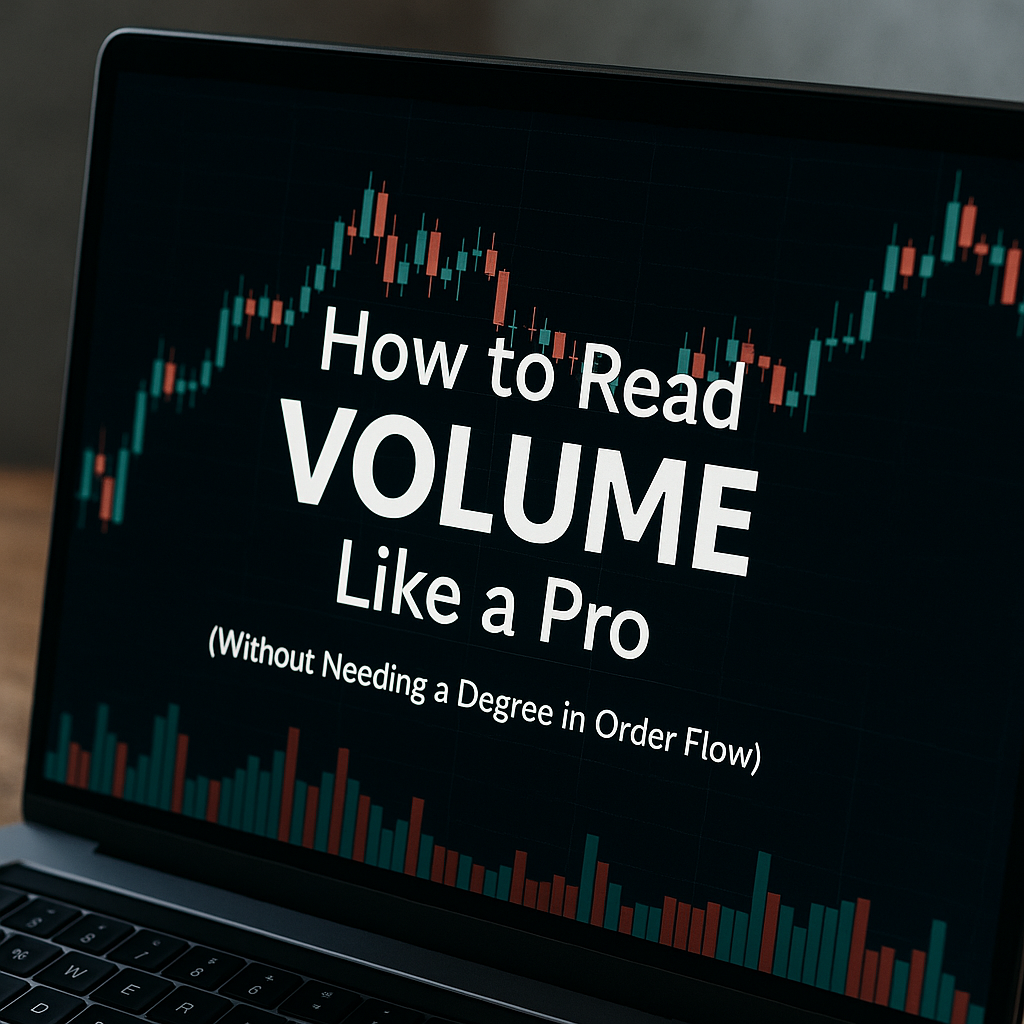
How to Read Volume Like a Pro
Read Volume Like a Pro
(Without Needing a Degree in Order Flow)
Volume is often overlooked by newer traders — or misunderstood entirely.
But used correctly, volume tells you whether the price move you’re seeing is believable — or built on air.
Let’s unpack how to understand volume, what to look for in key situations, and how to avoid the “volume trap” that catches many beginners.
What Volume Actually Tells You
Volume shows how much participation is happening at a given price. It reflects:
-
Commitment of buyers/sellers
-
Strength behind moves
-
Areas of interest or hesitation
Price moves with volume = power
Price moves without volume = potential trap
3 Key Volume Concepts to Master
1. Breakout + Volume = Strength
When price breaks a range or level:
-
High volume = strong move likely to continue
-
Low volume = likely fakeout or trap
2. Exhaustion Volume
After a strong move:
-
A sudden spike in volume + reversal candle can mean exhaustion
-
Everyone who wanted in — already is in
Watch for this on big news days or parabolic runs.
3. Volume Clusters at Structure
When you see high volume in a tight range, it often signals:
-
Accumulation (smart money building a position)
-
Distribution (smart money unloading before reversal)
Look for breakouts after volume tightens.
Don’t Just Watch the Bars
Volume bars are helpful, but not everything. Focus on:
-
Context (Where is this happening?)
-
Timing (Session open? Close? Pre-market?)
-
Structure (At key level? Inside range?)
Volume confirms or questions what price is doing.
️ Learn With Titan
Titan Protect includes volume-aware logic built into the signal engine — so you don’t need to guess.
What we provide:
-
✅ Volume overlays + heat signatures at reaction zones
-
🔊 Breakout filters that require volume confirmation
-
📉 Exhaustion markers and reversal signals linked to spikes
-
🧠 Volume-Sentiment-Structure scoring built into the Confluence Engine
We make volume readable — and useful.
📩 [Want a walkthrough of how we use volume inside Titan? Just ask.]
Get the daily framework intelligence
Trade the framework, not the noise.
The principles in this article are how we read markets every day. Members get the live application: daily Pre-Asia, Pre-London, Pre-NY and Post-Close briefs across 20+ instruments, the indicator suite, the Foundry library, and live community.
Free Explorer tier · No card required · Upgrade when you’re ready