Nikkei 225 (NKY) – Daily Read
4 October 2026 | Index | Titan Macro Desk
68,956.7
The Nikkei 225 is attempting to turn a sharp rebound into a sustained breakout. Last price 68,957, 3.3 percent higher on the day, leaves the index pressing the top of its one-month range and within reach of a larger range expansion. The immediate view is constructive because buyers have restored short-term control, but conviction now depends on follow-through. At this location, strength must convert into acceptance above resistance. Otherwise, the move risks becoming an exhaustion push near the top of an established range.
The macro backdrop matters because an index move of this speed reflects more than routine dip buying. It signals renewed demand for Japanese equity exposure, but the asset class remains sensitive to shifts in global risk appetite, currency expectations, domestic policy perceptions, and the earnings outlook for major exporters. Momentum roughly 6.1 percent up over the last two weeks confirms that buyers have been willing to chase recovery rather than merely defend weakness. The one month average 65,130 provides important context: price is above it, and the structure reads as a recovery attempt, back above the one-month average but still under the longer one. That combination supports further upside in the near term while warning that the broader repair is not yet complete.
The first test is the month swing high 68,995, about 0.1 percent above the current price. This matters because it is the nearest proven point where supply has previously capped progress. The 69,000 handle reinforces that barrier by concentrating attention and likely order flow around a highly visible threshold. A decisive move above 68,995 opens the path toward 69,608, which is the upper boundary of the three month range 60,449 to 69,608. Sustained trade beyond that ceiling would indicate that the recovery has matured into a genuine breakout.
On the downside, 68,000 is the first nearby handle that should attract buyers if the advance is healthy. Holding it would keep the market close enough to resistance for another attempt and would show that participants are accepting the higher price area. Failure there would not immediately destroy the recovery, but it would raise the probability of a deeper retracement toward the one month average 65,130. Below that, a shelf of support at 62,726, about 9.0 percent below, is the critical structural defence. Losing 62,726 exposes 60,449 and would shift the interpretation from consolidation after strength to a failed recovery within the broader range.
The bull path is straightforward: if 68,000 holds and buyers force a decisive move above 68,995, then 69,000 should become support and 69,608 becomes the next objective. If that ceiling is absorbed, the market would be signalling stronger demand than the recent range could contain. The bear path begins if rejection near 68,995 pushes price back below 68,000. If selling then carries through 65,130, the rebound loses credibility; if 62,726 subsequently fails, 60,449 comes into view.
The main risk to the constructive read is a breakout that cannot hold, especially after such a fast advance. A reversal through 68,000 would question immediate momentum, while sustained weakness below 65,130 would invalidate the near-term bullish stance. Net, buyers have control, but 68,995 is the proof point: clear it decisively and the range ceiling is vulnerable; reject there and the recovery remains unfinished.
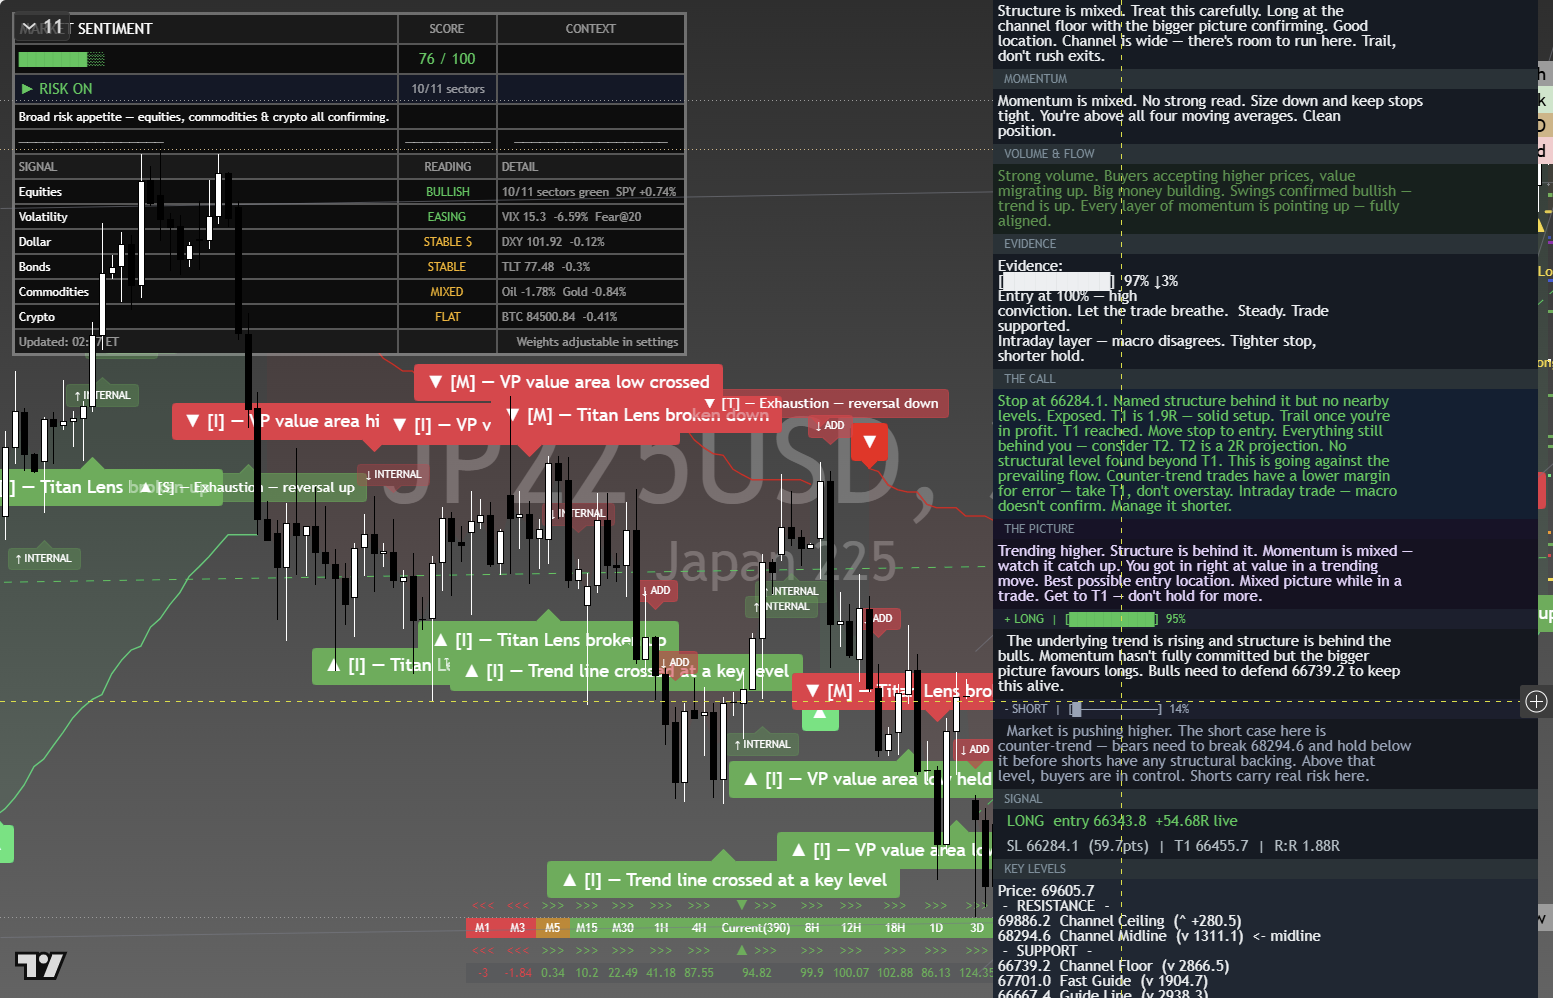
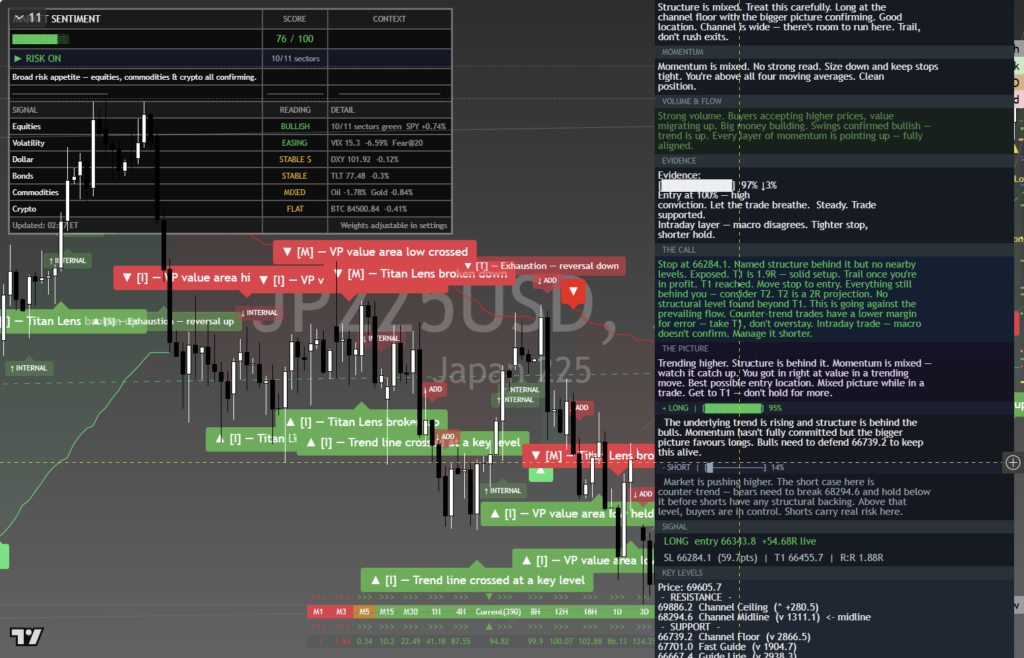
The chart above is the full daily read: structure, momentum, the levels that matter, and where the current price sits against them. Read it top to bottom for the complete picture, and pair it with our session briefs for the wider market context.
This is analysis, not financial advice. It reflects our multi-factor framework and is not a recommendation to buy or sell. Always do your own research and manage your risk.