AMD – Daily Read
2 October 2026 | Stock | Titan Macro Desk
$615.73
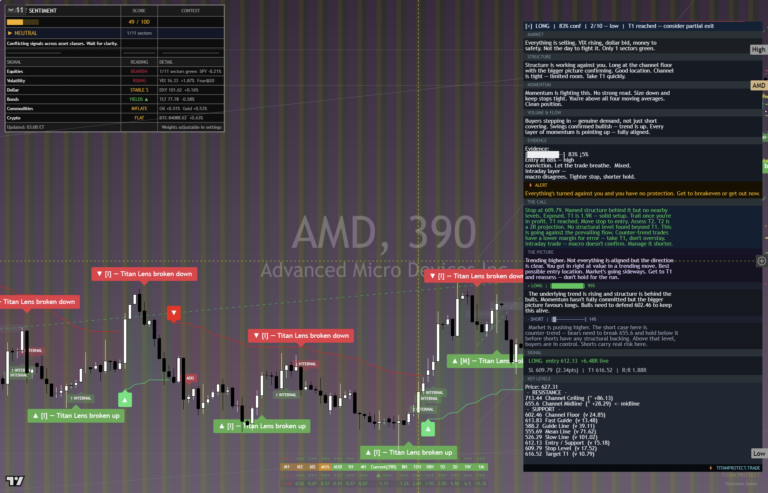
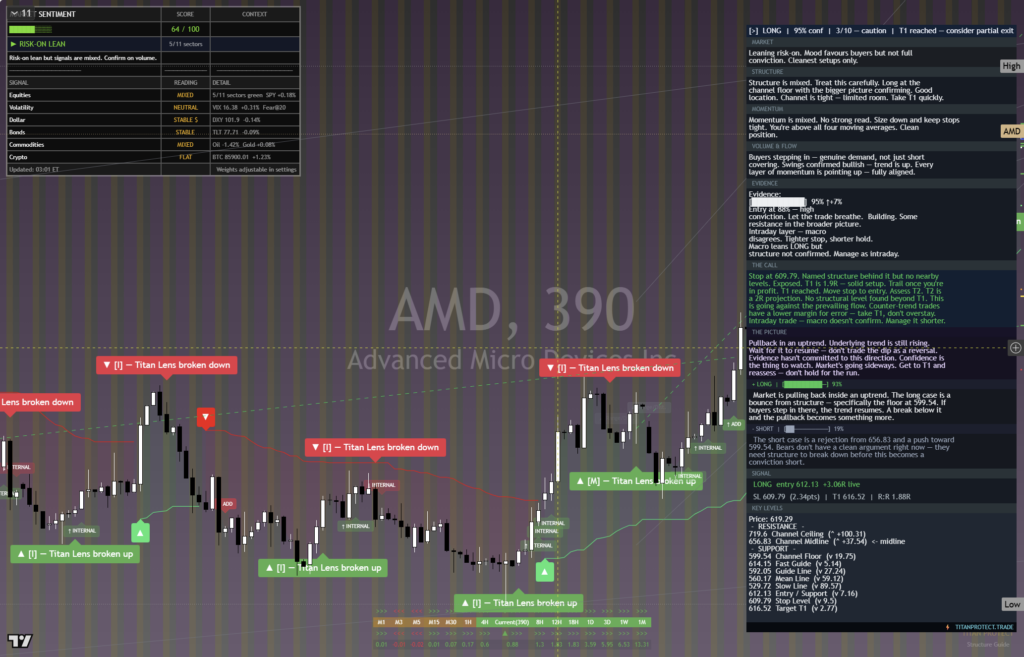
AMD is trading like a leadership stock rather than merely participating in a broad risk bid. The last price is $615.73, 0.6 percent higher on the day, and it is pressing the top of its one-month range. That matters because strength near the upper boundary signals that buyers are accepting elevated prices instead of waiting for a deeper reset. The clear view is constructive: demand remains in control, but the stock is close enough to major resistance that confirmation now matters more than enthusiasm.
The broader backdrop is still about confidence in growth, capital spending, and the durability of demand for advanced computing. Semiconductor shares are particularly sensitive to changes in risk appetite because expectations are priced well ahead of delivered results. For AMD, that makes execution, competitive positioning, and confidence in future demand more important than a routine market move. Momentum is roughly 10.0 percent up over the last two weeks, while the one month average is $560.92. Price is above it, and the structure reads as a clean uptrend, price above both its one-month and longer averages. That alignment supports continuation, although the speed of the advance also raises the cost of disappointing fresh buyers.
The immediate battleground is defined by the nearer round number handles at $620.00 and $610.00. Holding $610.00 would show that buyers are willing to defend a shallow pullback, while sustained trade above $620.00 would indicate improving acceptance near the range ceiling. The month swing high is $638.95, about 3.8 percent above the current price, making it the decisive supply test. The wider three month range is $424.03 to $638.95, so a break through the upper boundary would mark a genuine range expansion rather than routine noise. Far below, a shelf of support sits at $440.50, about 28.5 percent below. That shelf represents the deeper structural defense, where prior demand would need to reassert itself to preserve the broader recovery.
The bull path is straightforward. If AMD holds $610.00, establishes itself above $620.00, and then delivers a decisive move above $638.95, the path opens toward $648.95. That sequence would show that overhead supply has been absorbed and that buyers are prepared to chase strength beyond the established range. The bear path begins if $620.00 repeatedly rejects price and $610.00 fails to hold. That would suggest momentum is tiring and would shift attention back toward the one month average at $560.92. If selling then deepens enough to lose $440.50, the range structure breaks and exposes $424.03.
The main risk is that strong recent momentum has pulled expectations forward, leaving AMD vulnerable to any deterioration in the growth narrative, semiconductor demand, or market risk appetite. The constructive read is invalidated by failure to defend nearby handles followed by sustained trade beneath the average structure. The deeper bullish case fails outright if $440.50 gives way. Net, AMD remains firmly constructive, but the best evidence now comes from acceptance above $638.95, not simply another attempt at it.
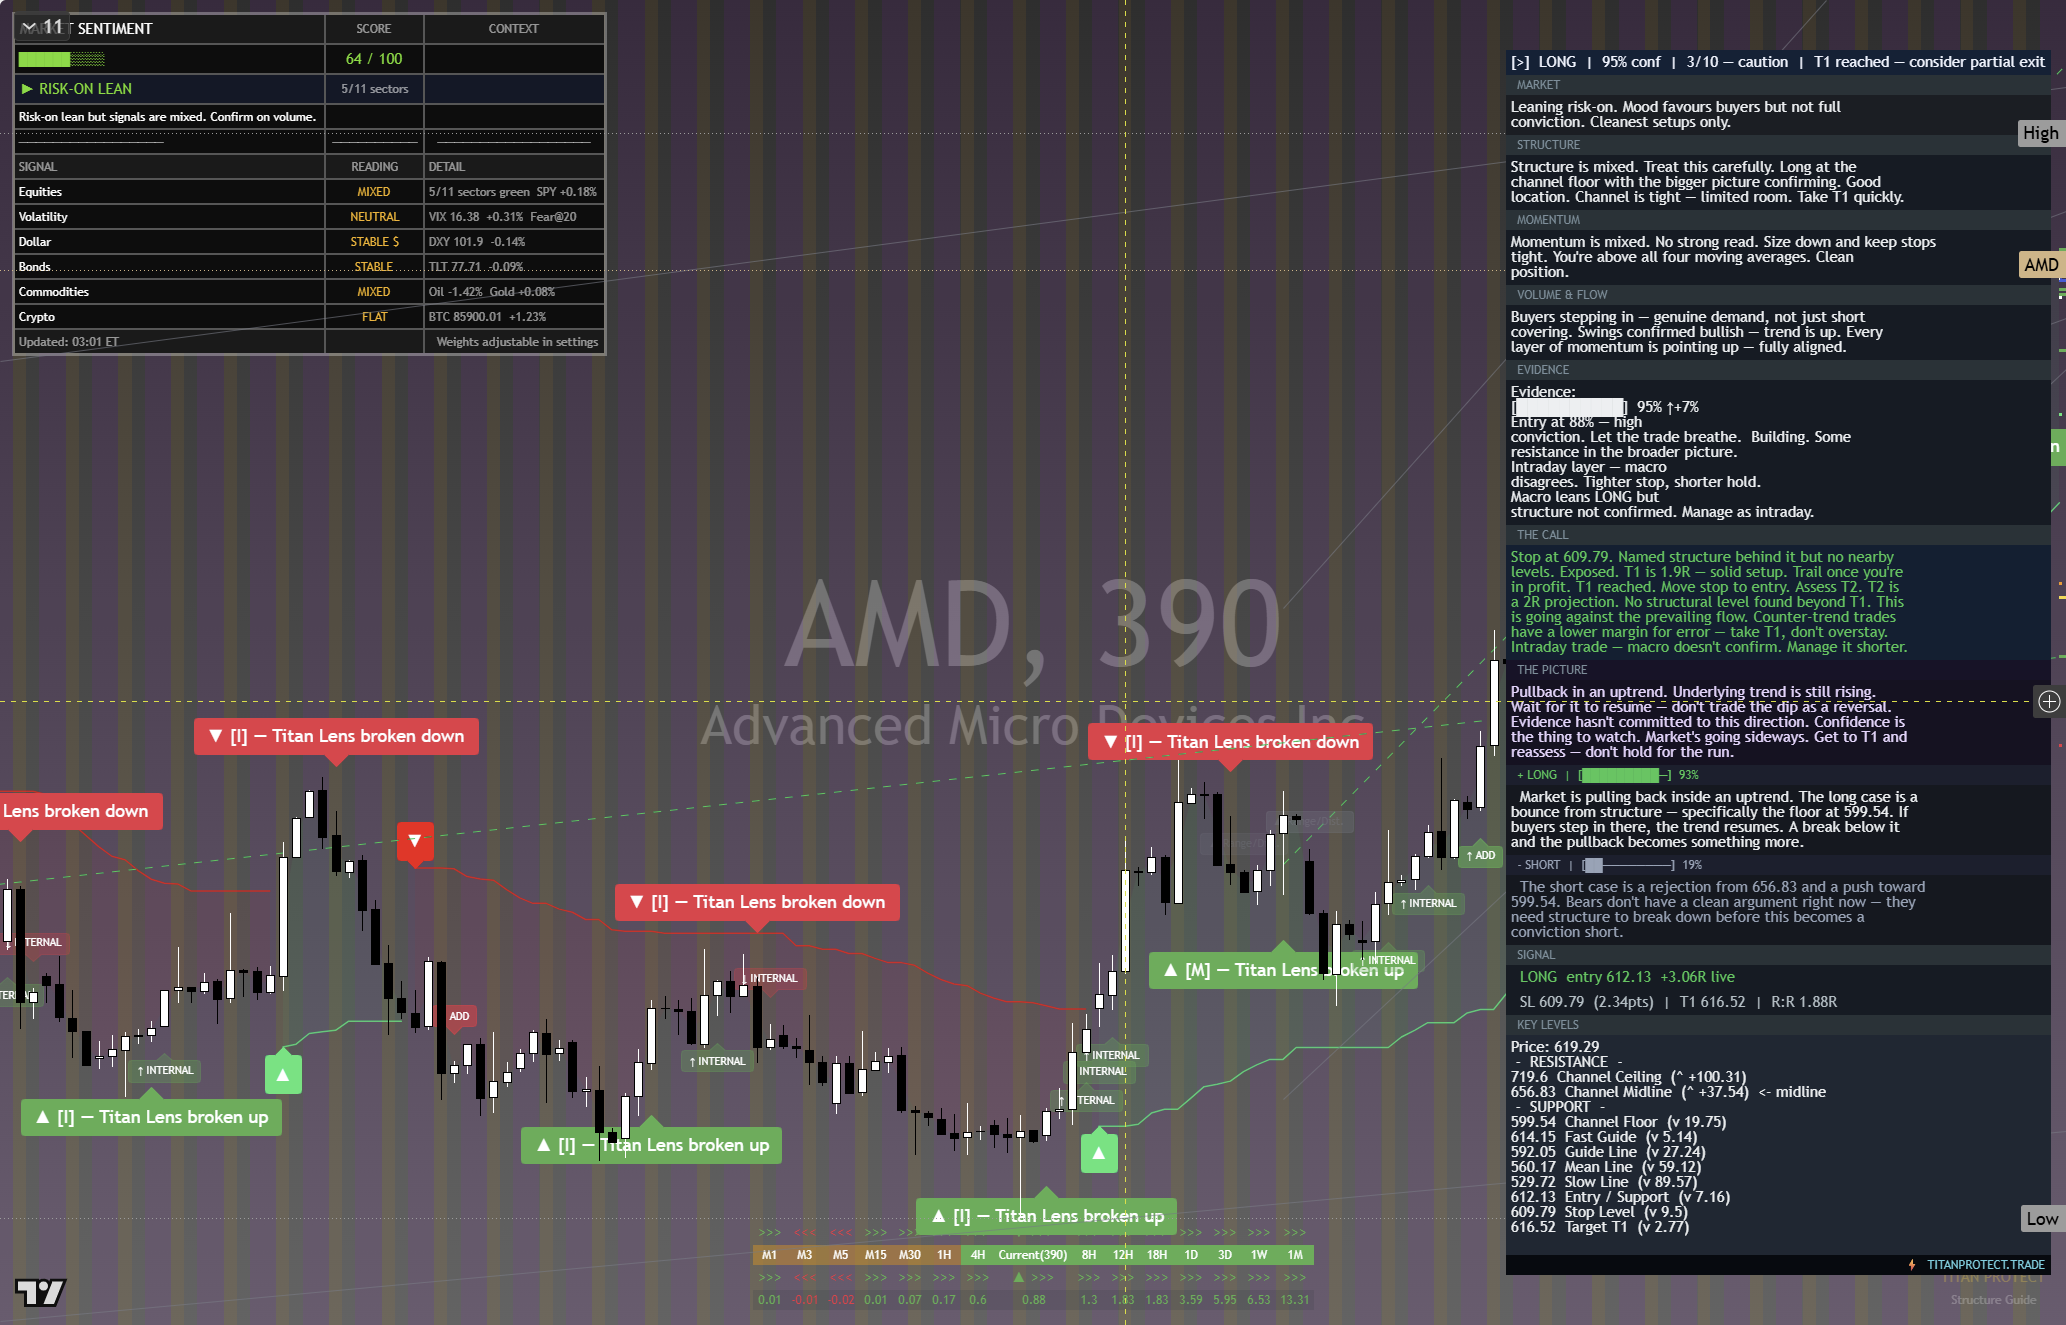
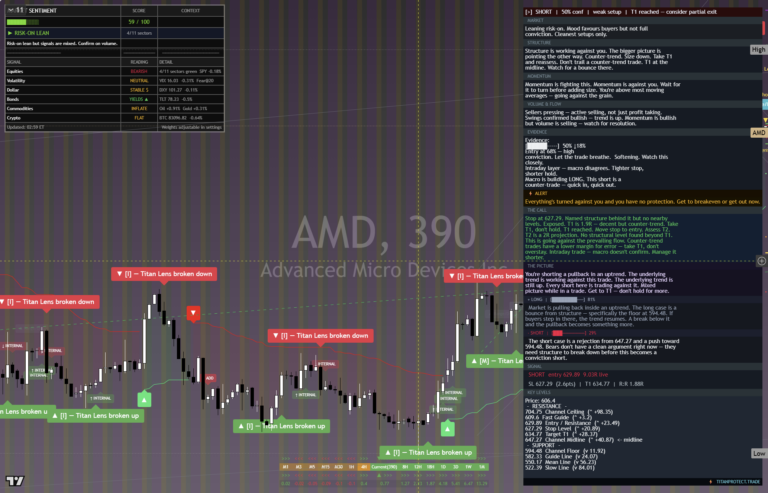
The chart above is the full daily read: structure, momentum, the levels that matter, and where the current price sits against them. Read it top to bottom for the complete picture, and pair it with our session briefs for the wider market context.
This is analysis, not financial advice. It reflects our multi-factor framework and is not a recommendation to buy or sell. Always do your own research and manage your risk.