AMD – Daily Read
15 September 2026 | Stock | Titan Macro Desk
$516.13
AMD is trying to turn a strong rebound into a durable breakout. Last price $516.13, 2.5 percent higher on the day. It is pressing the top of its one-month range, which matters because acceptance here would show that buyers can maintain control after the initial recovery. The clear view is constructive but conditional: demand is improving, yet the stock remains close enough to major overhead supply that chasing strength before confirmation carries poor asymmetry.
The macro backdrop is still defined by how investors price growth, capital spending, and the cost of funding long-duration earnings. That makes semiconductors especially sensitive to changes in risk appetite and expectations for artificial intelligence infrastructure demand. For AMD, the immediate driver is renewed confidence expressed through price, with the shares recovering faster than their recent baseline. Momentum roughly 8.3 percent up over the last two weeks. The one month average $481.99; price is above it, and the structure reads as a recovery attempt, back above the one-month average but still under the longer one. That final qualification is important because the rally has repaired near-term damage without yet proving a broader trend change.
The first decision area is formed by the nearer round number handles at $520.00 and $510.00. Holding above $510.00 would show that buyers are defending the recent advance on routine weakness, while sustained trade through $520.00 would indicate that supply near the range ceiling is being absorbed. The month swing high $526.79, about 2.1 percent above the current price, is the real confirmation point because it marks the boundary between another failed test and genuine range expansion. The wider three month range $318.86 to $574.20 frames both the opportunity and the downside. A shelf of support at $440.50, about 14.7 percent below, is where the recovery thesis would face its most consequential test, as buyers there would be defending the base of the latest advance rather than merely a nearby handle.
If AMD holds $510.00, clears $520.00, and then secures a decisive move above $526.79, the bull path is a continuation toward $574.20. That sequence would matter because each step removes a distinct layer of supply and strengthens the case that the recovery is becoming a broader advance. If the stock fails near $520.00 or $526.79 and then loses $510.00, the bear path begins with a retreat toward the one month average $481.99. Failure to stabilize there would shift attention to $440.50, where the structure must hold to preserve the recovery attempt. Losing $440.50 exposes $318.86.
The main risk is false acceptance above the range ceiling, especially if broader appetite for growth stocks weakens or semiconductor demand expectations cool. A brief push above $526.79 followed by a fast reversal below $510.00 would undermine breakout conviction. The read is fully invalidated by a loss of $440.50 because that would turn recovery into failed repair. Net, AMD has a bullish near-term bias, but confirmation above $526.79 is required before the upside case deserves full conviction.
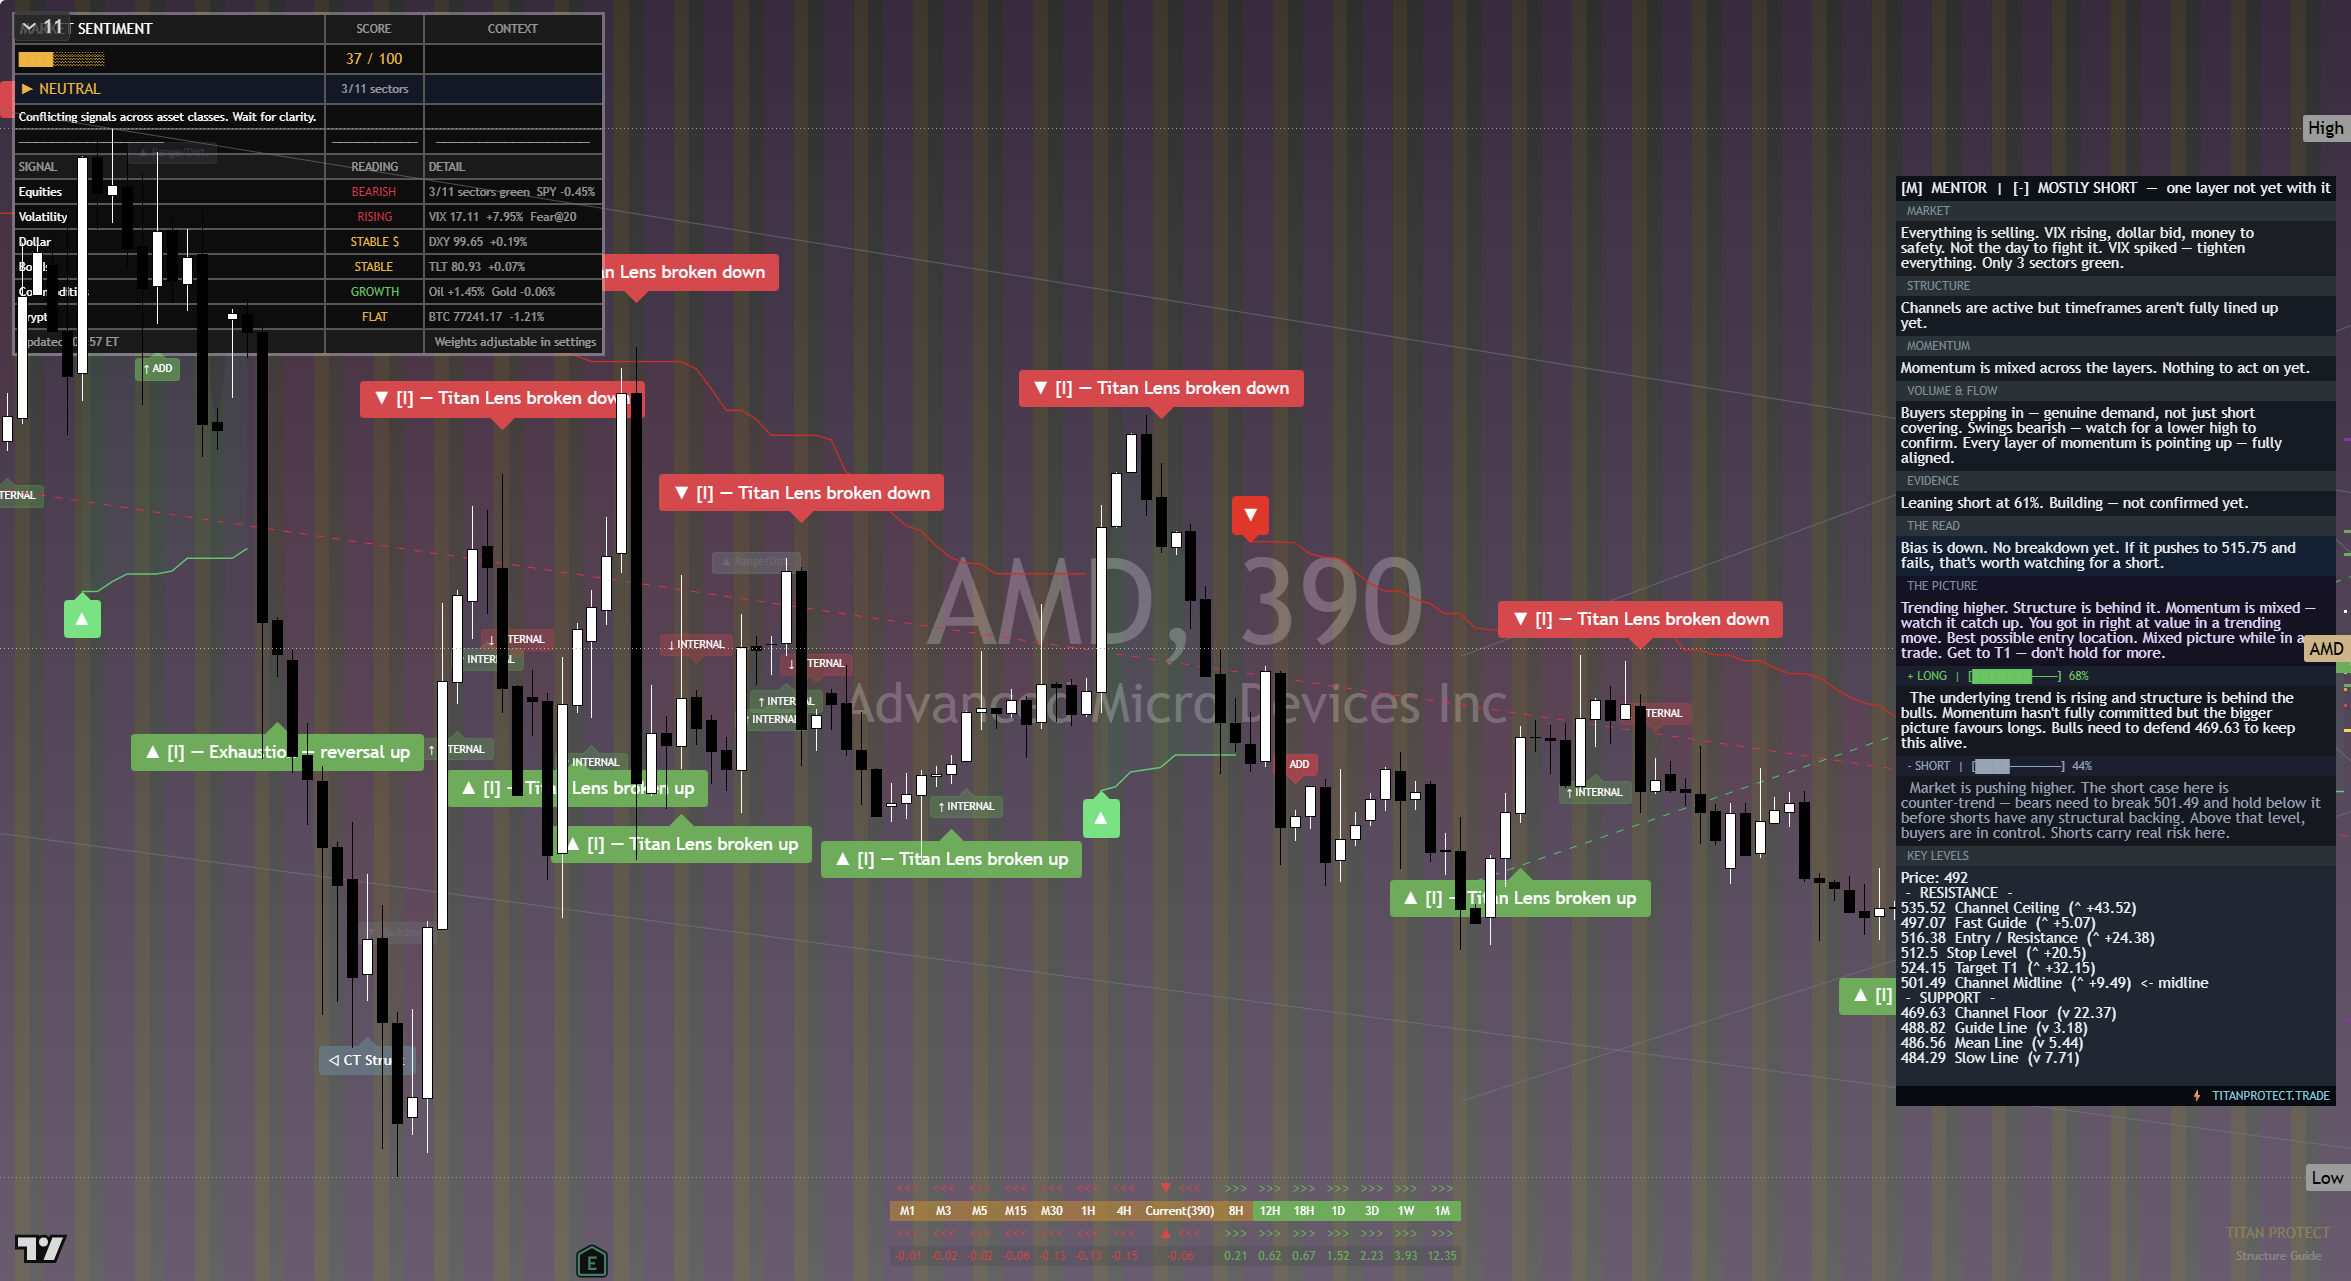
The chart above is the full daily read: structure, momentum, the levels that matter, and where the current price sits against them. Read it top to bottom for the complete picture, and pair it with our session briefs for the wider market context.
This is analysis, not financial advice. It reflects our multi-factor framework and is not a recommendation to buy or sell. Always do your own research and manage your risk.