Meta (META) – Daily Read
11 September 2026 | Stock | Titan Macro Desk
$644.38
Meta is in a constructive but increasingly demanding position. Last price $644.38, 1.4 percent lower on the day. That decline looks more like hesitation near resistance than a decisive rejection, because it is pressing the top of its one-month range after a forceful recovery. The clear view is cautiously bullish while the stock holds its reclaimed ground, but chasing strength here carries poor asymmetry unless buyers prove they can absorb supply overhead.
The broader backdrop matters because large growth stocks remain sensitive to shifts in rate expectations, risk appetite, and confidence in corporate spending. For Meta specifically, the market is balancing resilient advertising economics and enthusiasm around artificial intelligence against heavy investment requirements, execution risk, and regulatory pressure. Momentum roughly 11.8 percent up over the last two weeks. That speed suggests buyers have regained control, but it also means expectations have risen quickly. Near the upper end of the recent range, incremental gains now require fresh conviction rather than simple relief from oversold positioning.
One month average $583.84; price is above it, and the structure reads as a recovery attempt, back above the one-month average but still under the longer one. That makes the recovery credible, though not yet fully established across broader time horizons. The nearer round number handles at $650.00 and $640.00 define the immediate contest. Holding $640.00 would show that buyers are willing to defend shallow weakness, while acceptance above $650.00 would indicate that supply near the range top is being absorbed.
The month swing high $663.50, about 3.0 percent above the current price, is the key confirmation point. It matters because sellers previously established control there, so clearing it would convert resistance into evidence of renewed demand. The Three month range $524.52 to $677.85 frames the larger battlefield. A shelf of support at $537.28, about 16.6 percent below, is the deeper line that protects the recovery thesis. Its distance from the market also highlights how much downside could open if confidence deteriorates.
The bull path is straightforward: if Meta holds $640.00, reclaims $650.00, and attracts sustained buying through the prior peak, then a decisive move above $663.50 opens the path toward $677.85. That sequence would show progression from defense to acceptance and finally breakout confirmation. The bear path begins if $650.00 repeatedly rejects price and $640.00 fails to hold. If selling then pushes the stock back through $583.84, the recovery attempt would lose credibility. If weakness deepens further, losing $537.28 exposes $524.52.
The principal risk is that the recent advance has already discounted favorable operating expectations while leaving the shares vulnerable to weaker market breadth, higher financing pressure, softer advertising demand, or concern about investment intensity. The bullish read is invalidated by sustained trade below the recovered average, with the strongest failure signal coming at deeper support. Net, Meta retains an upward bias, but confirmation above the month high is needed before the move deserves full conviction.
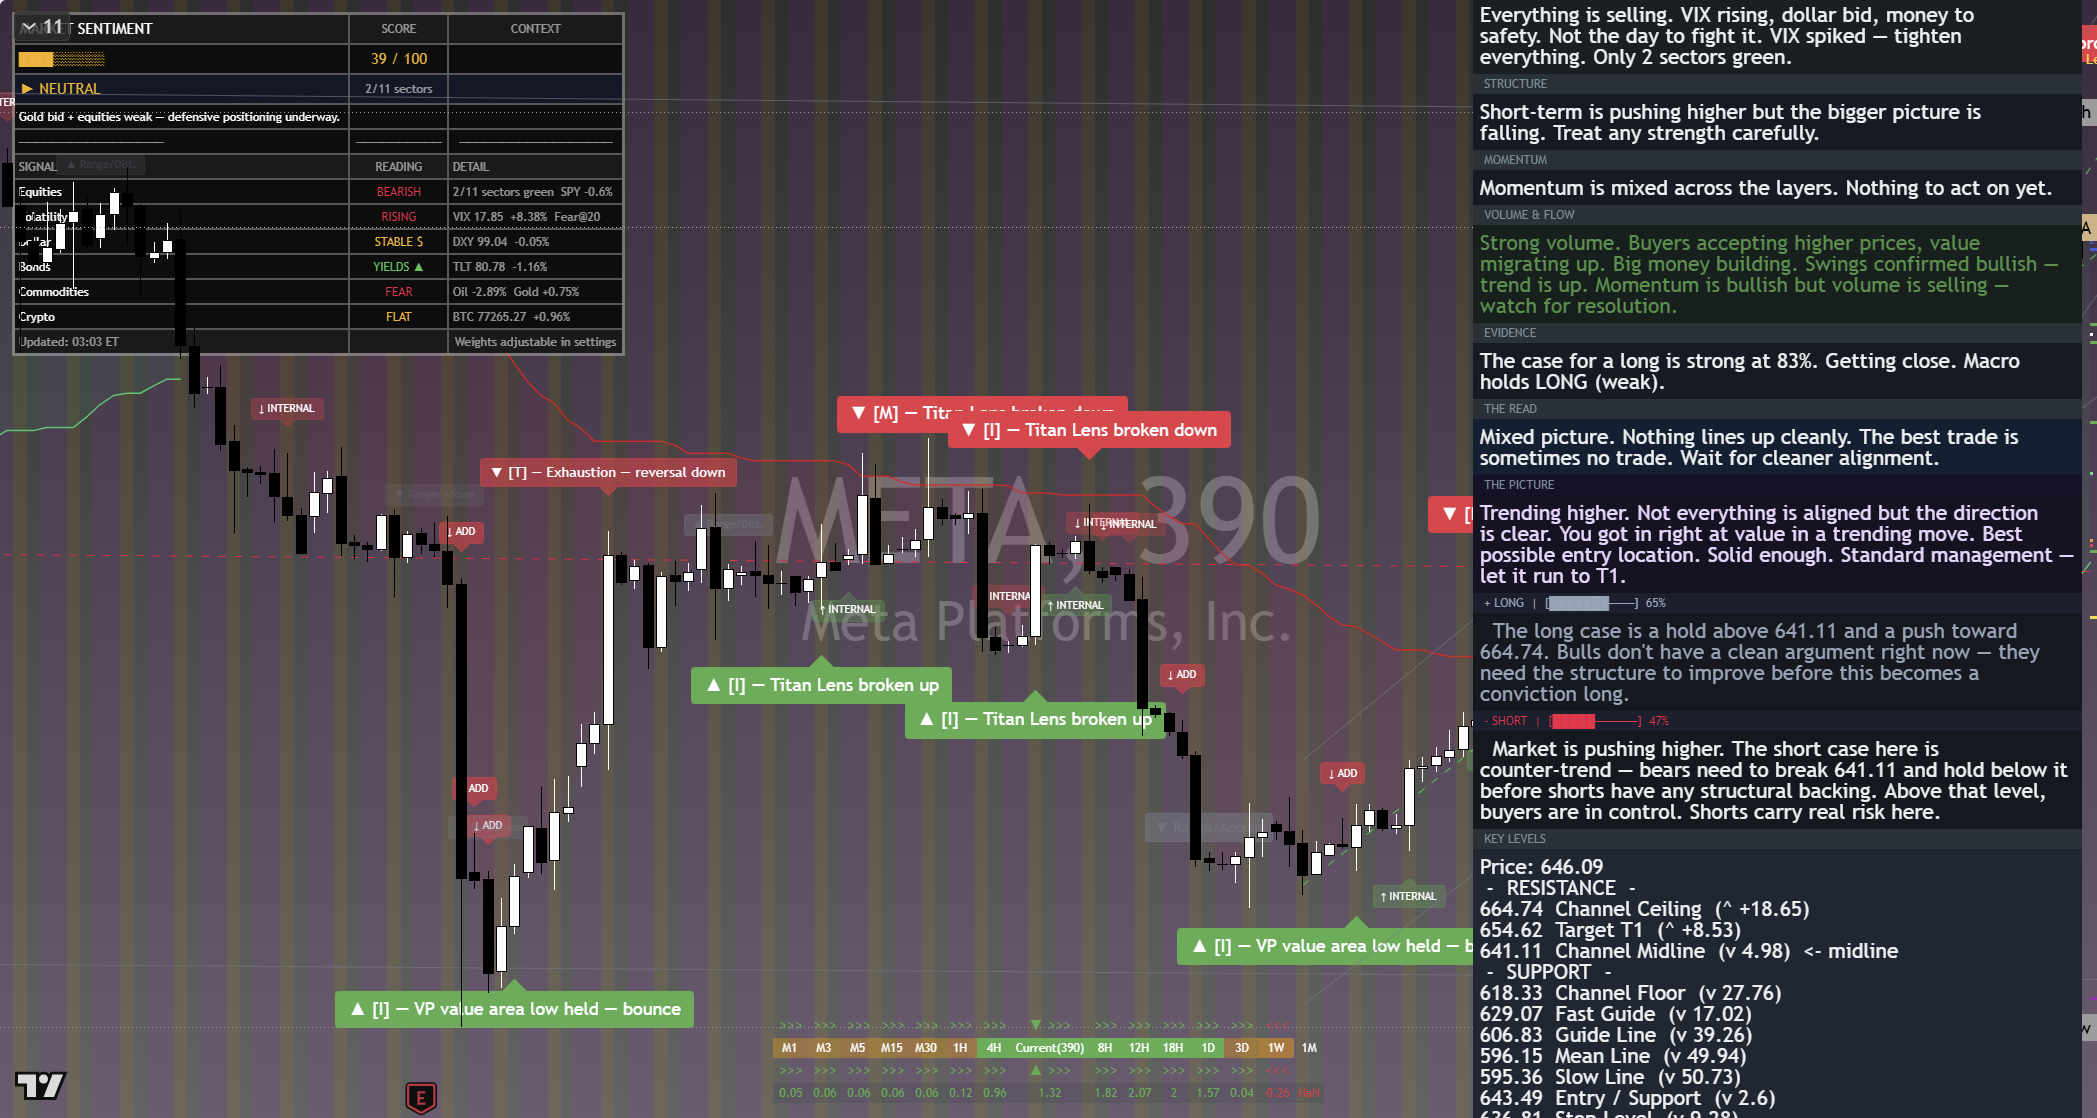
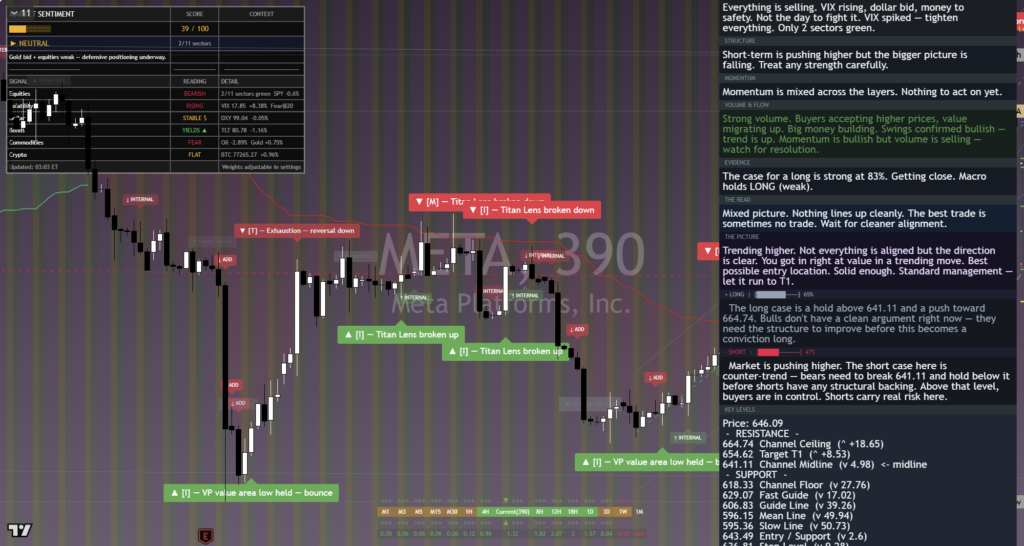
The chart above is the full daily read: structure, momentum, the levels that matter, and where the current price sits against them. Read it top to bottom for the complete picture, and pair it with our session briefs for the wider market context.
This is analysis, not financial advice. It reflects our multi-factor framework and is not a recommendation to buy or sell. Always do your own research and manage your risk.