Meta (META) – Daily Read
9 September 2026 | Stock | Titan Macro Desk
$613.48
Meta is testing whether a sharp recovery can become a durable breakout. Last price $613.48, 0.5 percent lower on the day, leaves the stock pressing the top of its one-month range after a strong rebound. The constructive view is that buyers retain control while price holds the nearby breakout area, but this is also where conviction must replace momentum. Failure near the range ceiling would turn a promising recovery into another rejected rally.
The wider backdrop is less forgiving for growth stocks. Higher energy costs, geopolitical tension, and renewed concern about restrictive rates are pressuring valuations, particularly where investors must fund ambitious spending today for returns expected later. Meta sits directly inside that debate. Its advertising engine remains supported by improving targeting, measurement, and engagement, while artificial intelligence strengthens recommendations and monetization. The counterweight is heavy infrastructure investment and investor scrutiny over how quickly that spending converts into earnings and cash generation. Momentum roughly 9.7 percent up over the last two weeks shows the market has been willing to look through those concerns, but expectations have risen with the price.
The one month average $577.84 is the first meaningful structural reference. Price is above it, and the structure reads as a recovery attempt, back above the one-month average but still under the longer one. That makes $577.84 a marker of improving demand rather than confirmation of a fully repaired trend. The nearer round number handles at $620.00 and $610.00 frame the immediate contest. Holding $610.00 would show buyers absorbing routine profit-taking, while acceptance above $620.00 would indicate that supply near the range top is thinning.
The month swing high $624.80, about 1.8 percent above the current price, is the decisive ceiling. It matters because sellers previously gained control there, so a clean break must attract follow-through rather than merely trade through it briefly. Below, a shelf of support at $537.28, about 12.4 percent below, is the deeper line defending the recovery thesis. The three month range $524.52 to $678.62 defines the broader battlefield and shows that current price is elevated within that span without yet reclaiming its upper boundary.
The bull path is straightforward: if Meta holds $610.00, clears $620.00, and then sustains a decisive move above $624.80, the market is confirming that recent demand can overcome prior supply. A decisive move above $624.80 opens the path toward $678.62, with the advertising and artificial-intelligence narrative likely providing the fundamental justification.
The bear path begins if repeated rejection around $620.00 and $624.80 pushes price back through $610.00. If selling then carries Meta below $577.84, the recovery loses credibility and attention shifts to $537.28. Losing $537.28 exposes $524.52.
The principal risk to the bullish read is that rising rates, geopolitical stress, or renewed concern over infrastructure spending overwhelms company-specific execution. Sustained trade below $577.84 would invalidate the near-term constructive stance, while loss of $537.28 would invalidate the recovery structure itself. Net, Meta remains constructive but unconfirmed: buyers have momentum, while $624.80 remains the price of admission to a broader advance.
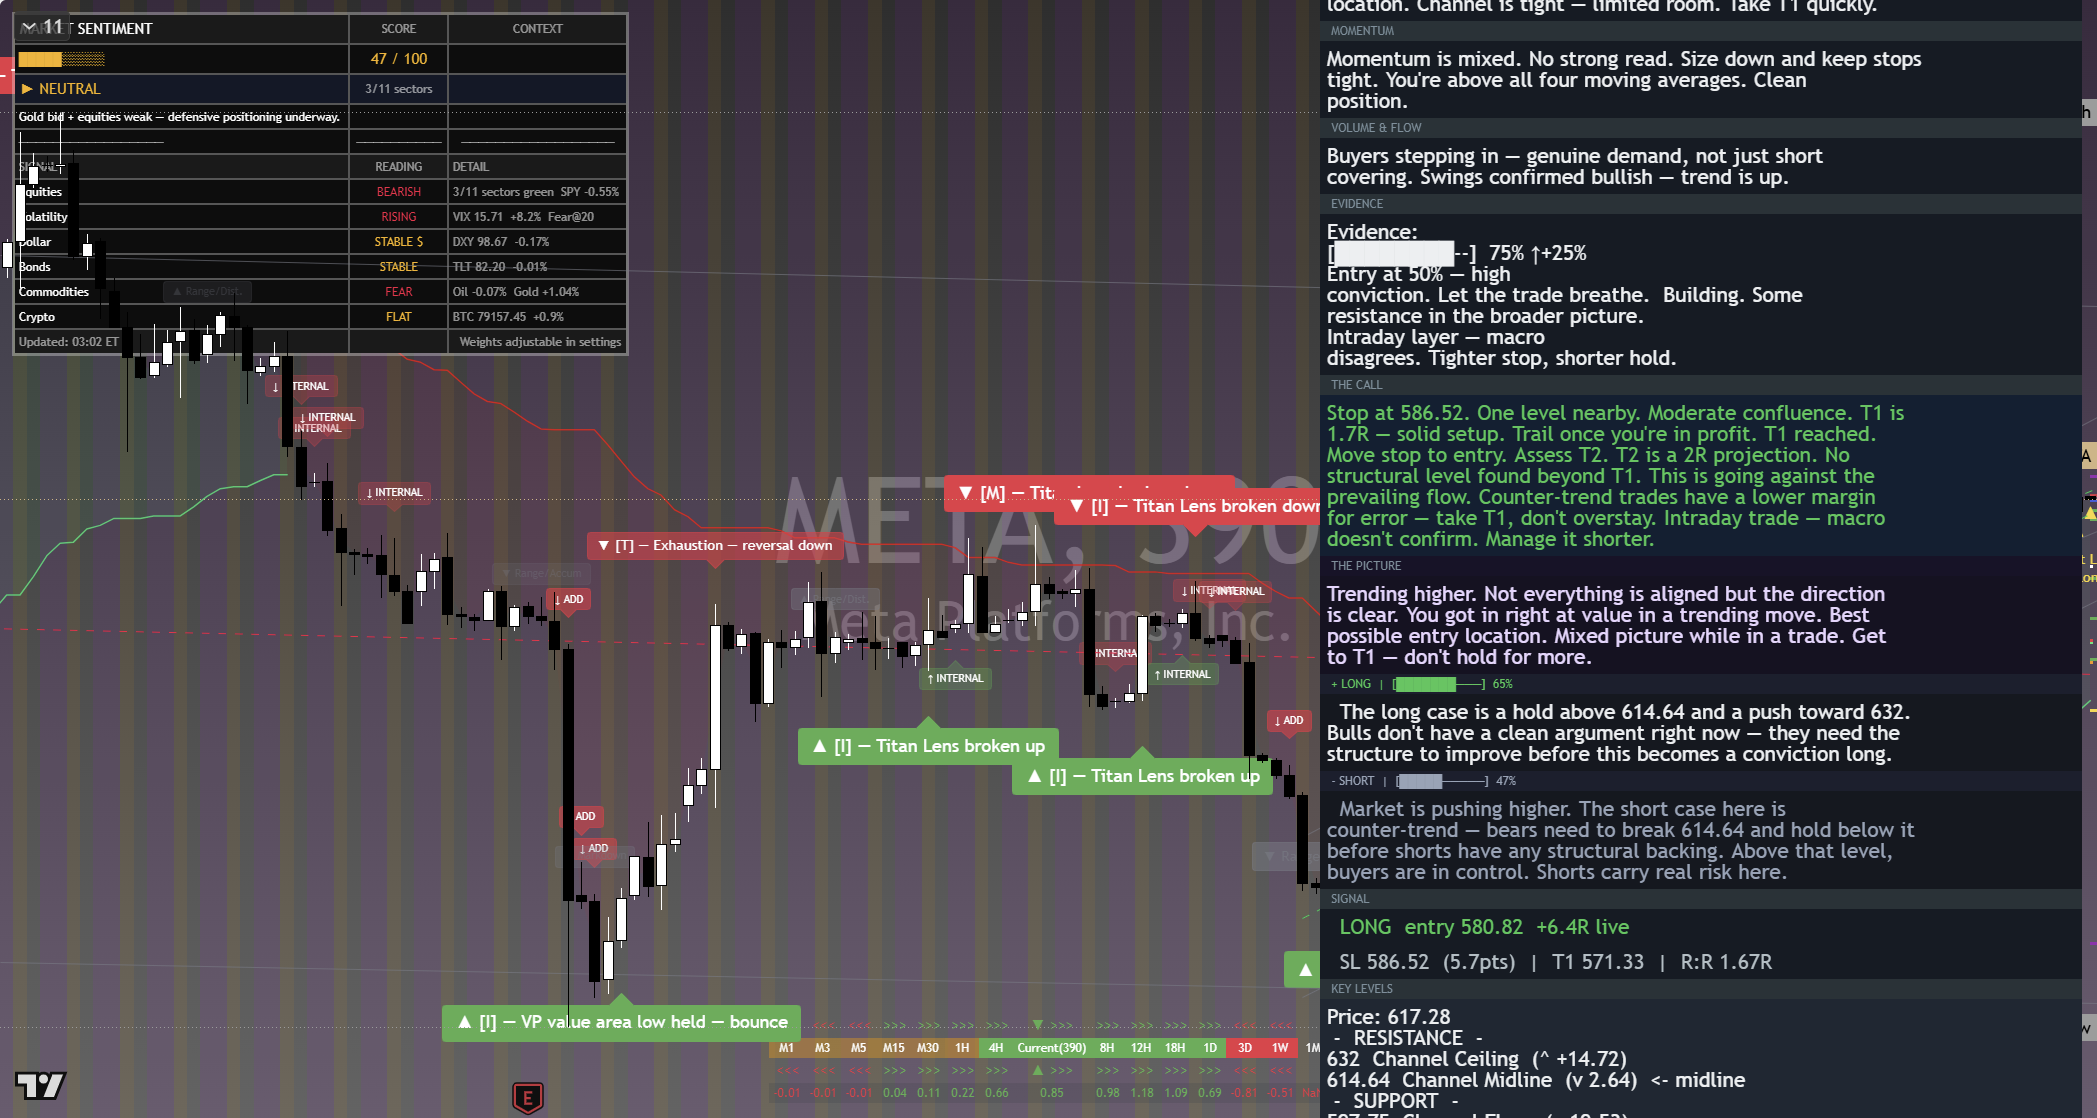
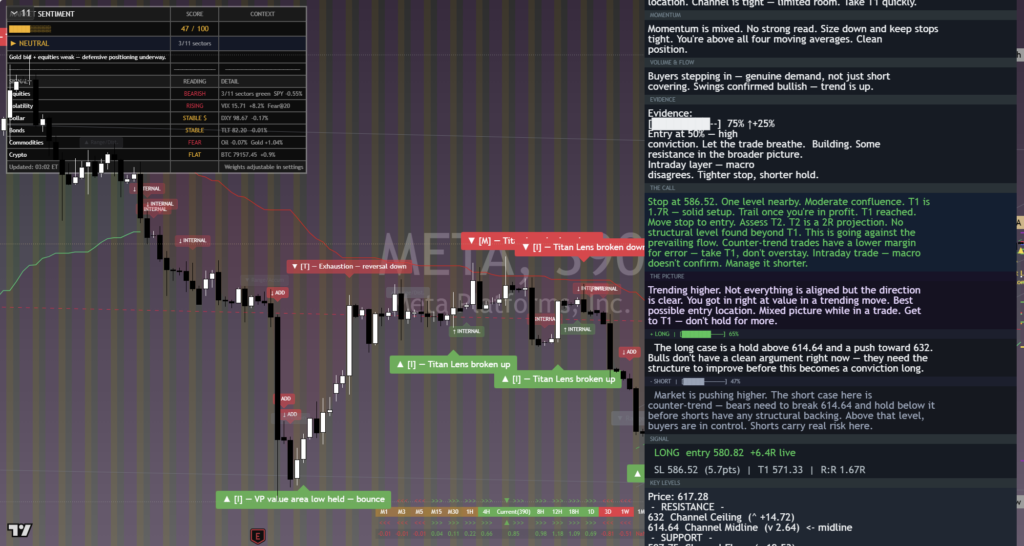
The chart above is the full daily read: structure, momentum, the levels that matter, and where the current price sits against them. Read it top to bottom for the complete picture, and pair it with our session briefs for the wider market context.
This is analysis, not financial advice. It reflects our multi-factor framework and is not a recommendation to buy or sell. Always do your own research and manage your risk.



