Apple (AAPL) – Daily Read
6 September 2026 | Stock | Titan Macro Desk
$319.97
Apple is absorbing a sharp daily setback without yet surrendering its broader advance. Last price $319.97, 2.5 percent lower on the day. That decline matters because it tests whether recent buyers have enough conviction to defend the trend when sentiment turns less forgiving. The clear view is constructive but conditional: the stock remains well placed within its recent structure, yet it now needs to stabilize around nearby handles before it can credibly challenge the month’s peak.
The macro backdrop is best understood through sensitivity rather than unsupported forecasts. Apple sits at the intersection of large-cap growth, consumer demand, supply-chain execution, and broad equity risk appetite. Changes in expectations around economic resilience, financing conditions, and corporate spending can therefore amplify company-specific moves. For this instrument, the immediate driver is the tension between profit-taking after recent strength and continued demand for a liquid market leader. It is holding in the upper half of its one-month range, which argues that the daily weakness is pressure within an advance rather than confirmed deterioration. Momentum roughly 3.4 percent up over the last two weeks reinforces that interpretation.
The one month average $313.18 is the first meaningful reference beneath the market. Price is above it, and the structure reads as a clean uptrend, price above both its one-month and longer averages. That area matters because it represents where recent positioning has broadly found balance. The nearer round number handles at $320.00 and $310.00 frame the immediate contest. Holding around $320.00 would show that buyers are willing to absorb the selloff quickly, while $310.00 is the more important lower handle because a sustained loss would place greater pressure on the one-month structure.
Above, the month swing high $330.81, about 3.4 percent above the current price, is the key supply test. Sellers who used the recent peak to reduce exposure are likely to defend it, so acceptance beyond that point would signal that demand has overcome the available supply. Below, a shelf of support at $300.57, about 6.1 percent below, is the main structural defense. The wider three month range $265.07 to $344.57 shows why these boundaries matter: Apple has room to move, but breaking either nearby edge could accelerate the journey toward the broader range extreme.
The bull path is straightforward. If Apple regains and holds $320.00, then the daily decline begins to look like controlled digestion. If buyers subsequently carry the stock through $330.81 with conviction, then prior supply has been cleared. A decisive move above $330.81 opens the path toward $344.57. The bear path begins if rebounds repeatedly fail around $320.00 and price slips through $310.00. If that weakness extends through $300.57, then the uptrend has suffered meaningful structural damage. Losing $300.57 exposes $265.07.
The central risk is that broad risk appetite weakens while company-specific expectations are being reduced, creating simultaneous pressure on valuation and earnings confidence. The constructive read is invalidated by a sustained loss of $300.57, not merely by volatility around the nearer handles. Net, Apple remains trend-positive above its recent balance area, but buyers must defend the low-$310 zone and reclaim $320.00 before the next upside attempt deserves full confidence.
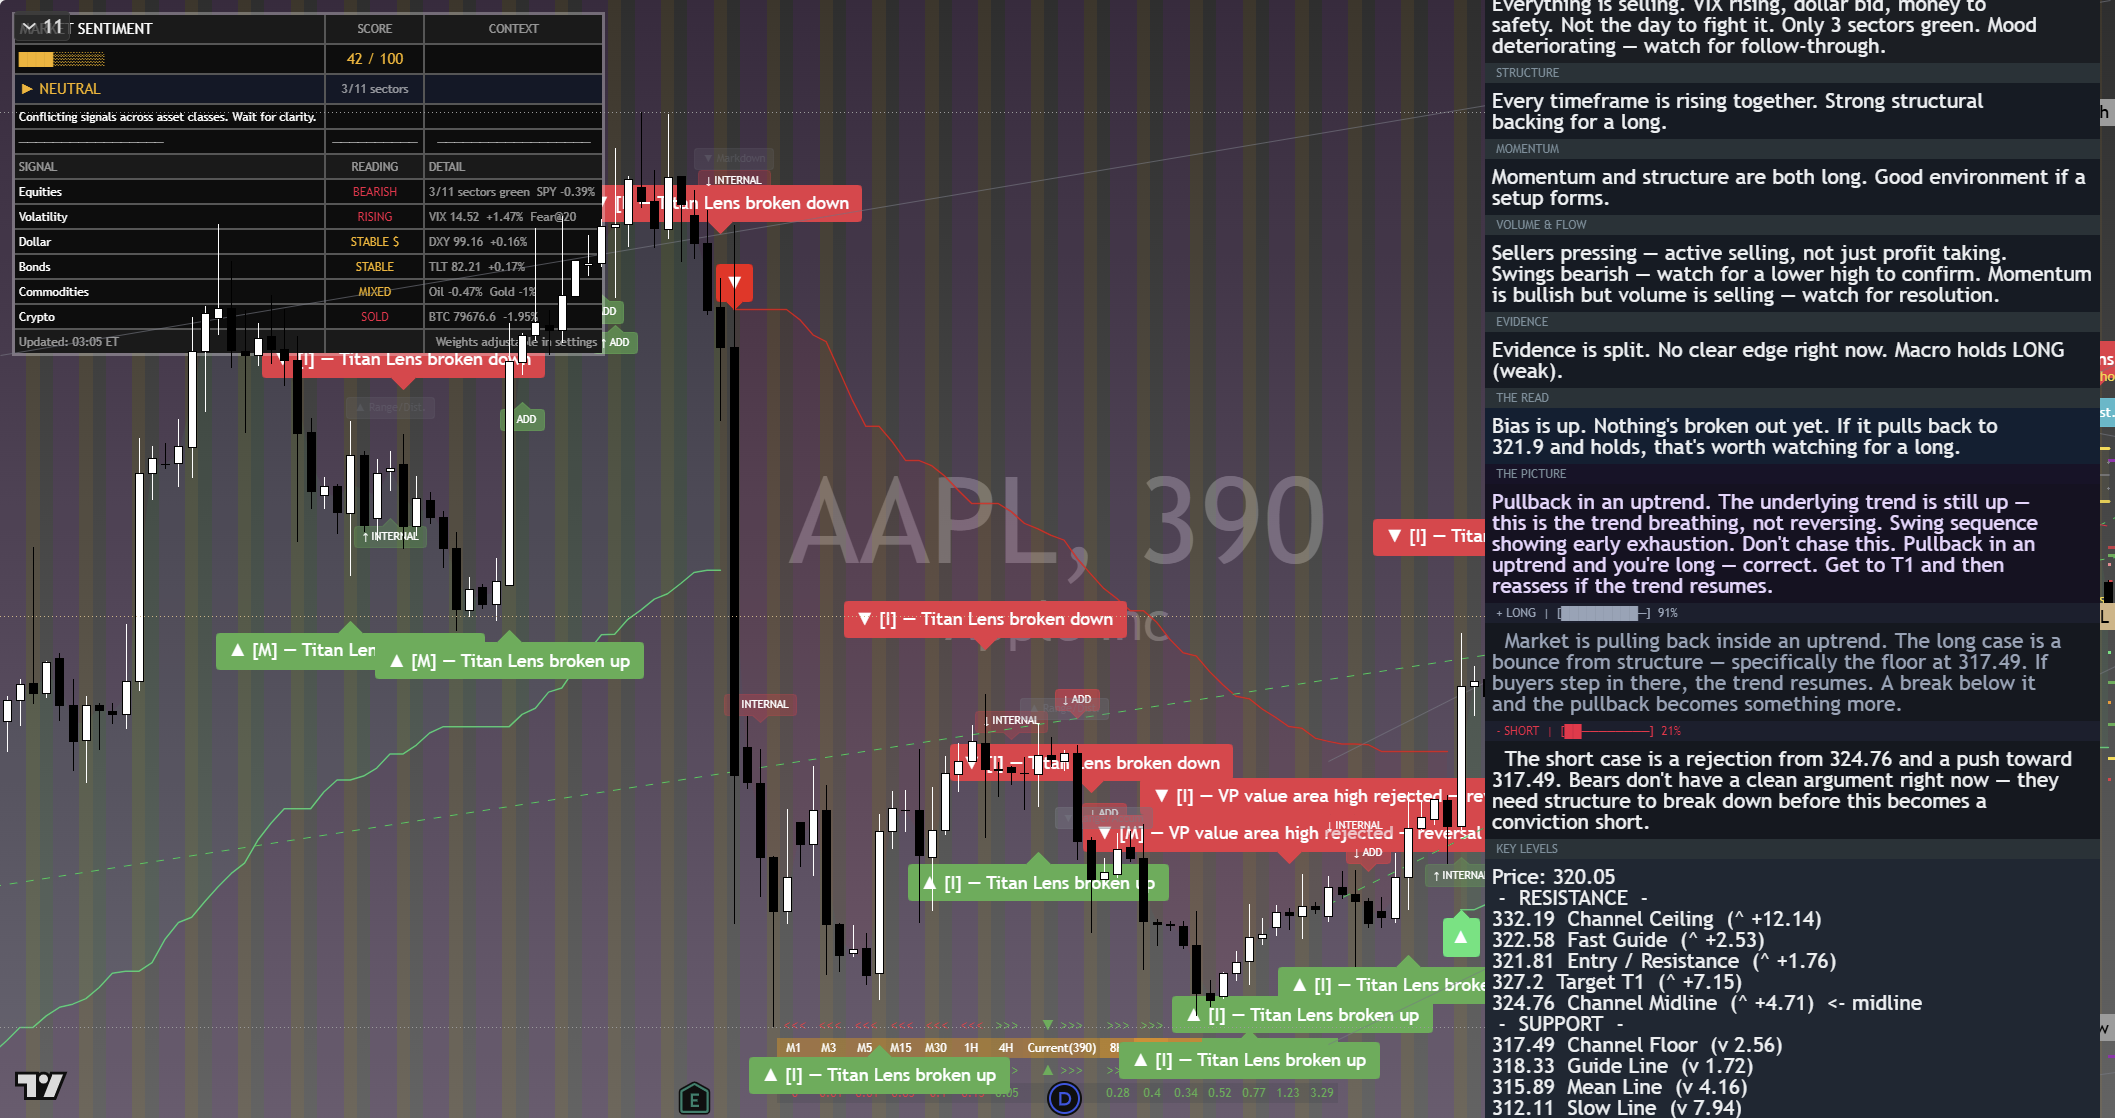
The chart above is the full daily read: structure, momentum, the levels that matter, and where the current price sits against them. Read it top to bottom for the complete picture, and pair it with our session briefs for the wider market context.
This is analysis, not financial advice. It reflects our multi-factor framework and is not a recommendation to buy or sell. Always do your own research and manage your risk.