Meta (META) – Daily Read
2 September 2026 | Stock | Titan Macro Desk
$578.54
Meta is attempting to turn recovery into trend, but it has not yet done enough to confirm a durable breakout. Last price $578.54, 1.1 percent higher on the day. That advance matters because the stock has reclaimed an important short-term reference after a meaningful rebound, yet overhead supply remains unresolved. The clear view is cautiously constructive: buyers have regained control of the near-term tape, but they still need to prove they can absorb sellers above the current area.
The broader backdrop is one in which changing rate expectations, growth confidence, and appetite for large-cap technology can quickly alter equity leadership. For Meta specifically, the market is balancing the durability of its core advertising engine and operating discipline against the capital intensity and uncertain payoff horizon attached to its strategic investments. It is sitting mid-range over the past month. One month average $574.44; price is above it, and the structure reads as a recovery attempt, back above the one-month average but still under the longer one. Momentum roughly 6.3 percent up over the last two weeks. That combination shows improving demand, but also warns that part of the recovery has already occurred.
The nearer round number handles at $580.00 and $570.00 define the immediate contest. Holding above $580.00 would suggest buyers are willing to pay through a psychologically important area, helping convert the rebound into a more credible advance. A rejection there followed by a move below $570.00 would weaken the short-term repair and put the one-month average back under pressure. The month swing high $612.42, about 5.9 percent above the current price, is the decisive ceiling because it marks where the latest recovery must overcome prior supply. A shelf of support at $537.28, about 7.1 percent below, is the main defensive line beneath the market, where value buyers previously showed willingness to absorb weakness. The three month range $524.52 to $682.50 frames the larger opportunity and risk.
The bull path is straightforward: if Meta establishes acceptance above $580.00, holds $574.44 on routine pullbacks, and then clears the month swing high, buyers gain evidence that the recovery is broadening beyond a short-covering or tactical bounce. A decisive move above $612.42 opens the path toward $682.50. The bear path begins if strength repeatedly fails around $580.00 and price loses $570.00. That would indicate fading demand and raise the probability of a deeper retracement. Losing $537.28 exposes $524.52.
The principal risk to the constructive view is that improving price action outruns the market’s willingness to underwrite Meta’s spending and earnings outlook, particularly if the wider large-cap technology trade loses sponsorship. The read is invalidated on a sustained failure below the support shelf, while the bearish case is invalidated by firm acceptance above the month swing high. Net, Meta deserves a positive bias while it holds its reclaimed short-term ground, but conviction should remain measured until overhead supply is decisively cleared.
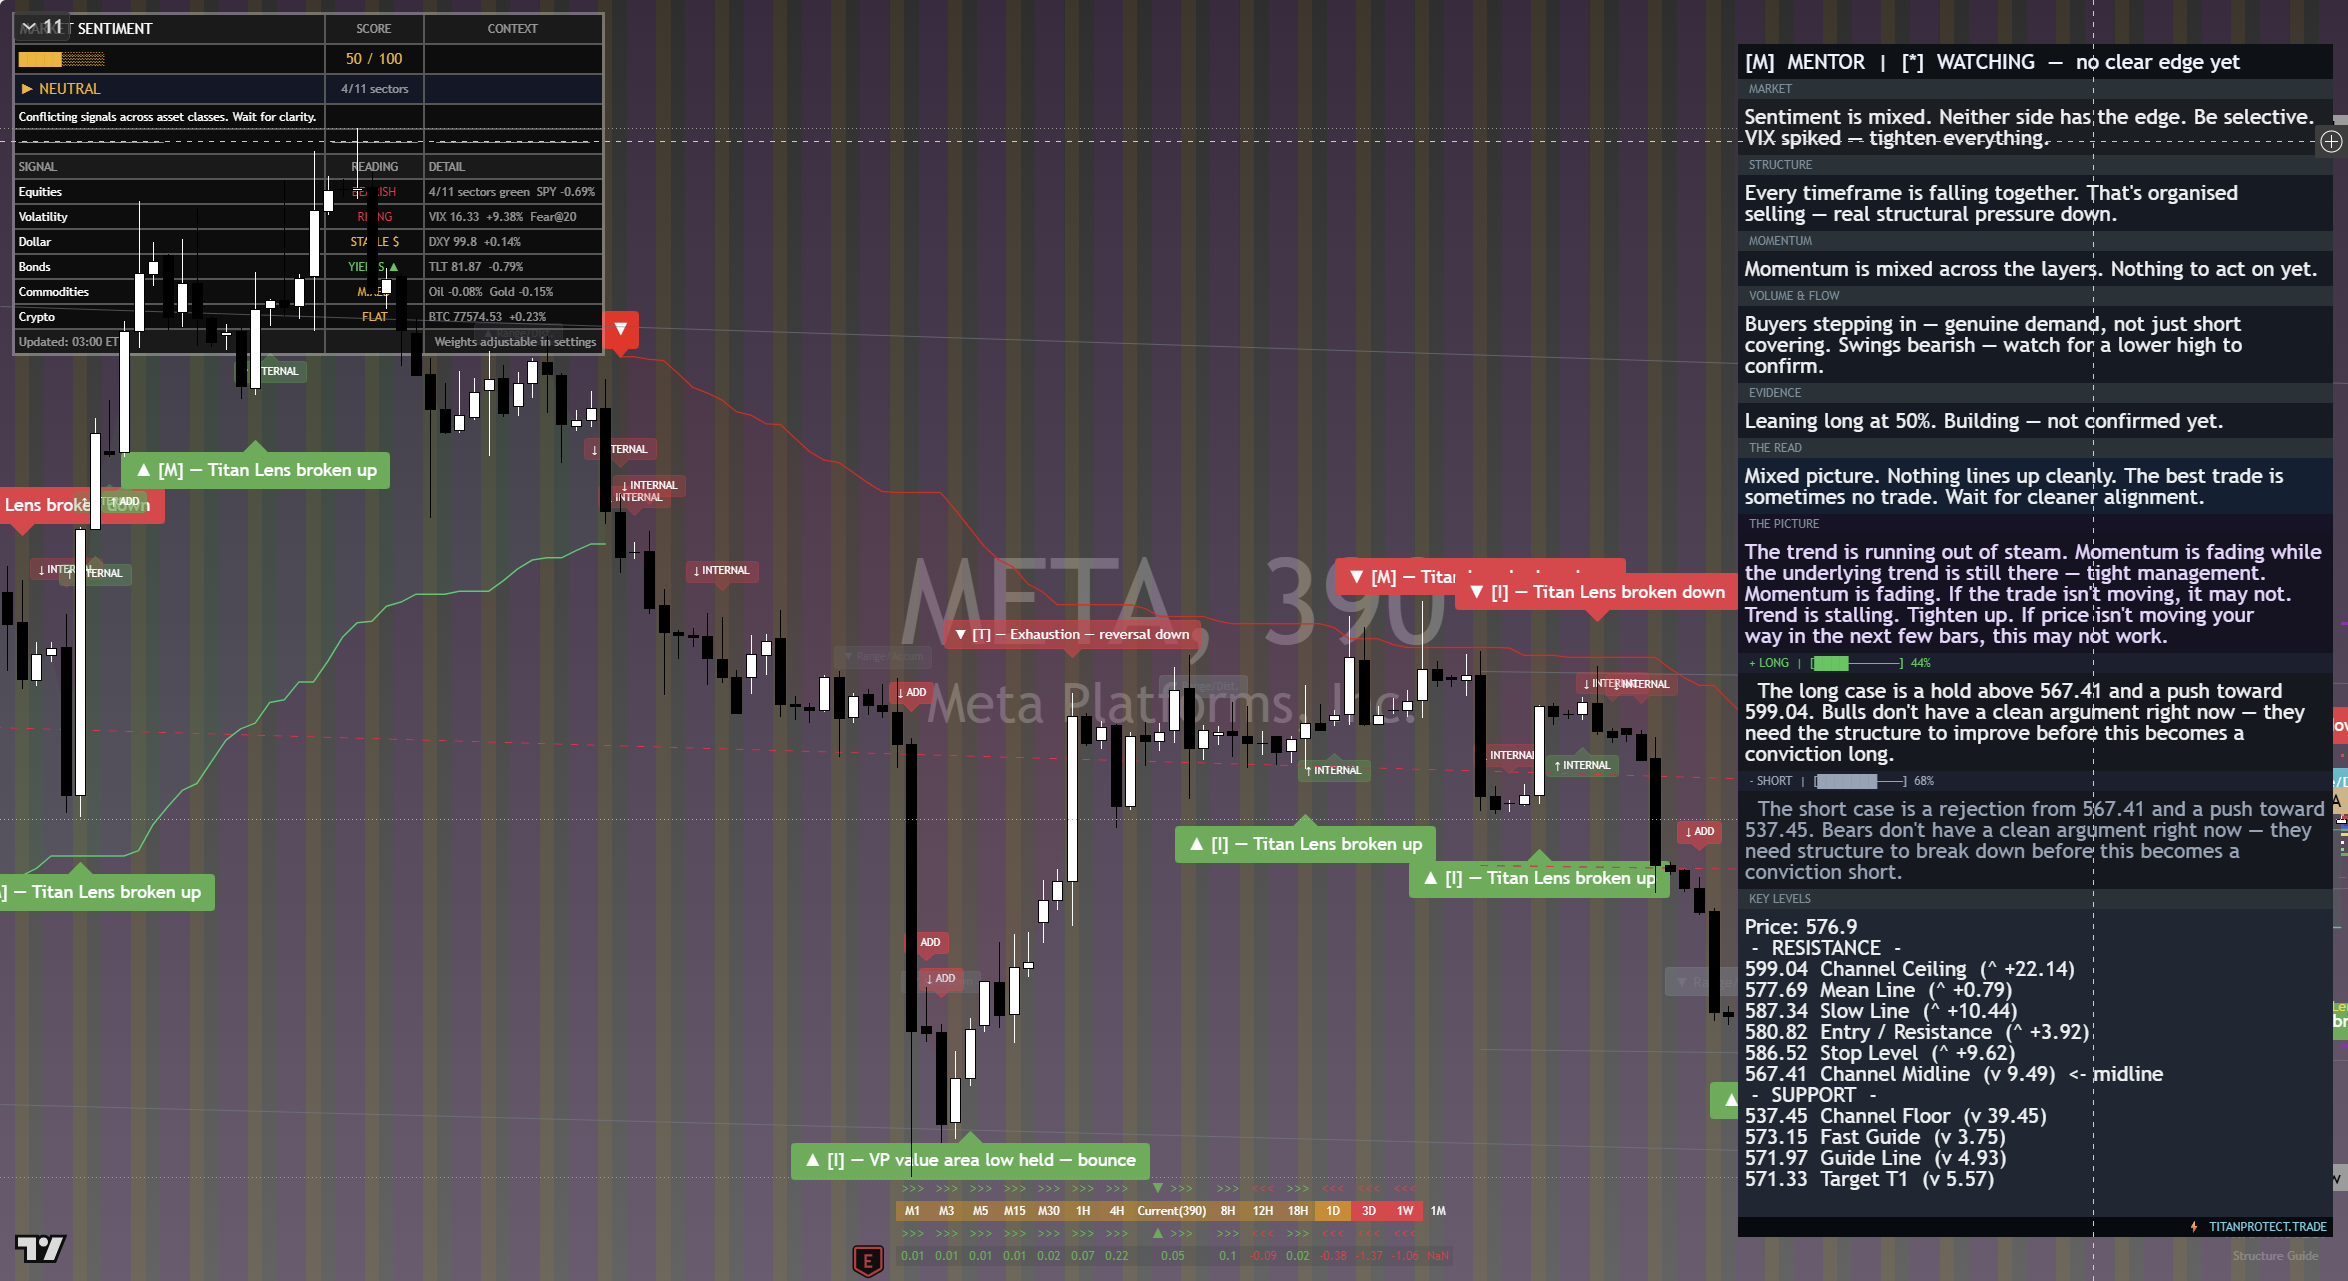
The chart above is the full daily read: structure, momentum, the levels that matter, and where the current price sits against them. Read it top to bottom for the complete picture, and pair it with our session briefs for the wider market context.
This is analysis, not financial advice. It reflects our multi-factor framework and is not a recommendation to buy or sell. Always do your own research and manage your risk.