Meta (META) – Daily Read
28 August 2026 | Stock | Titan Macro Desk
$578.02
Meta is trying to turn a short-term recovery into a more durable advance, with the last price at $578.02, 1.2 percent higher on the day. The constructive point is that buyers have regained an important reference area and kept the stock in the upper half of its one-month range. The restraint is that the broader repair remains incomplete. Momentum is roughly 2.0 percent down over the last two weeks, so this is an improving structure rather than a confirmed breakout.
The macro backdrop offers neither a clean tailwind nor a decisive obstacle. Hotter inflation prints in France and Spain lifted near-term European rate expectations, while steady Japanese labour data and modest upside in Tokyo CPI kept the BoJ policy path intact. EURUSD and GBPUSD both fell over half a percent as the dollar gained ground. That firmer dollar can temper enthusiasm across growth stocks, but the broader regime remains balanced ahead of the weekend. For Meta, the more relevant question is whether stock-specific demand can absorb that cross-asset caution and extend the rebound.
The one month average at $575.80 is the immediate pivot. Price is above it, and the structure reads as a recovery attempt, back above the one-month average but still under the longer one. Holding this area would show that buyers are accepting higher prices rather than merely producing a brief bounce. The nearby $580.00 handle is the first test of that acceptance. Sustained trade above it would improve confidence that the move has follow-through, while failure there would return attention to $570.00. That lower round number is the first practical defense for the recovery. Losing it would weaken the current bid and raise the risk of a deeper retest.
The month swing high at $612.42, about 6.0 percent above the current price, is the key upside barrier because it marks where the latest advance previously exhausted itself. A decisive move above $612.42 opens the path toward $682.50. That upper objective also defines the top of the three month range $524.52 to $682.50, so reaching it would represent a full challenge of the broader range rather than a routine extension. On the downside, a shelf of support at $524.52, about 9.3 percent below, is the major structural defense. It has range significance and should attract buyers if the recovery remains viable. Losing $524.52 exposes $514.52 and would shift the structure from repair toward renewed deterioration.
The bull path is straightforward: if Meta holds $575.80, establishes acceptance above $580.00, and then clears $612.42 decisively, buyers gain room to press toward $682.50. The bear path begins if $580.00 rejects the advance and $570.00 gives way. If selling then reaches and breaks $524.52, the recovery thesis fails and $514.52 becomes exposed.
The main risk is false strength into thin pre-weekend conviction, especially with the dollar firm and the longer-term structure not yet reclaimed. A sustained loss of $575.80 would challenge the immediate read, while a break of $524.52 would invalidate it. Net, Meta has a constructive recovery bias above $575.80, but real trend confirmation requires $612.42.
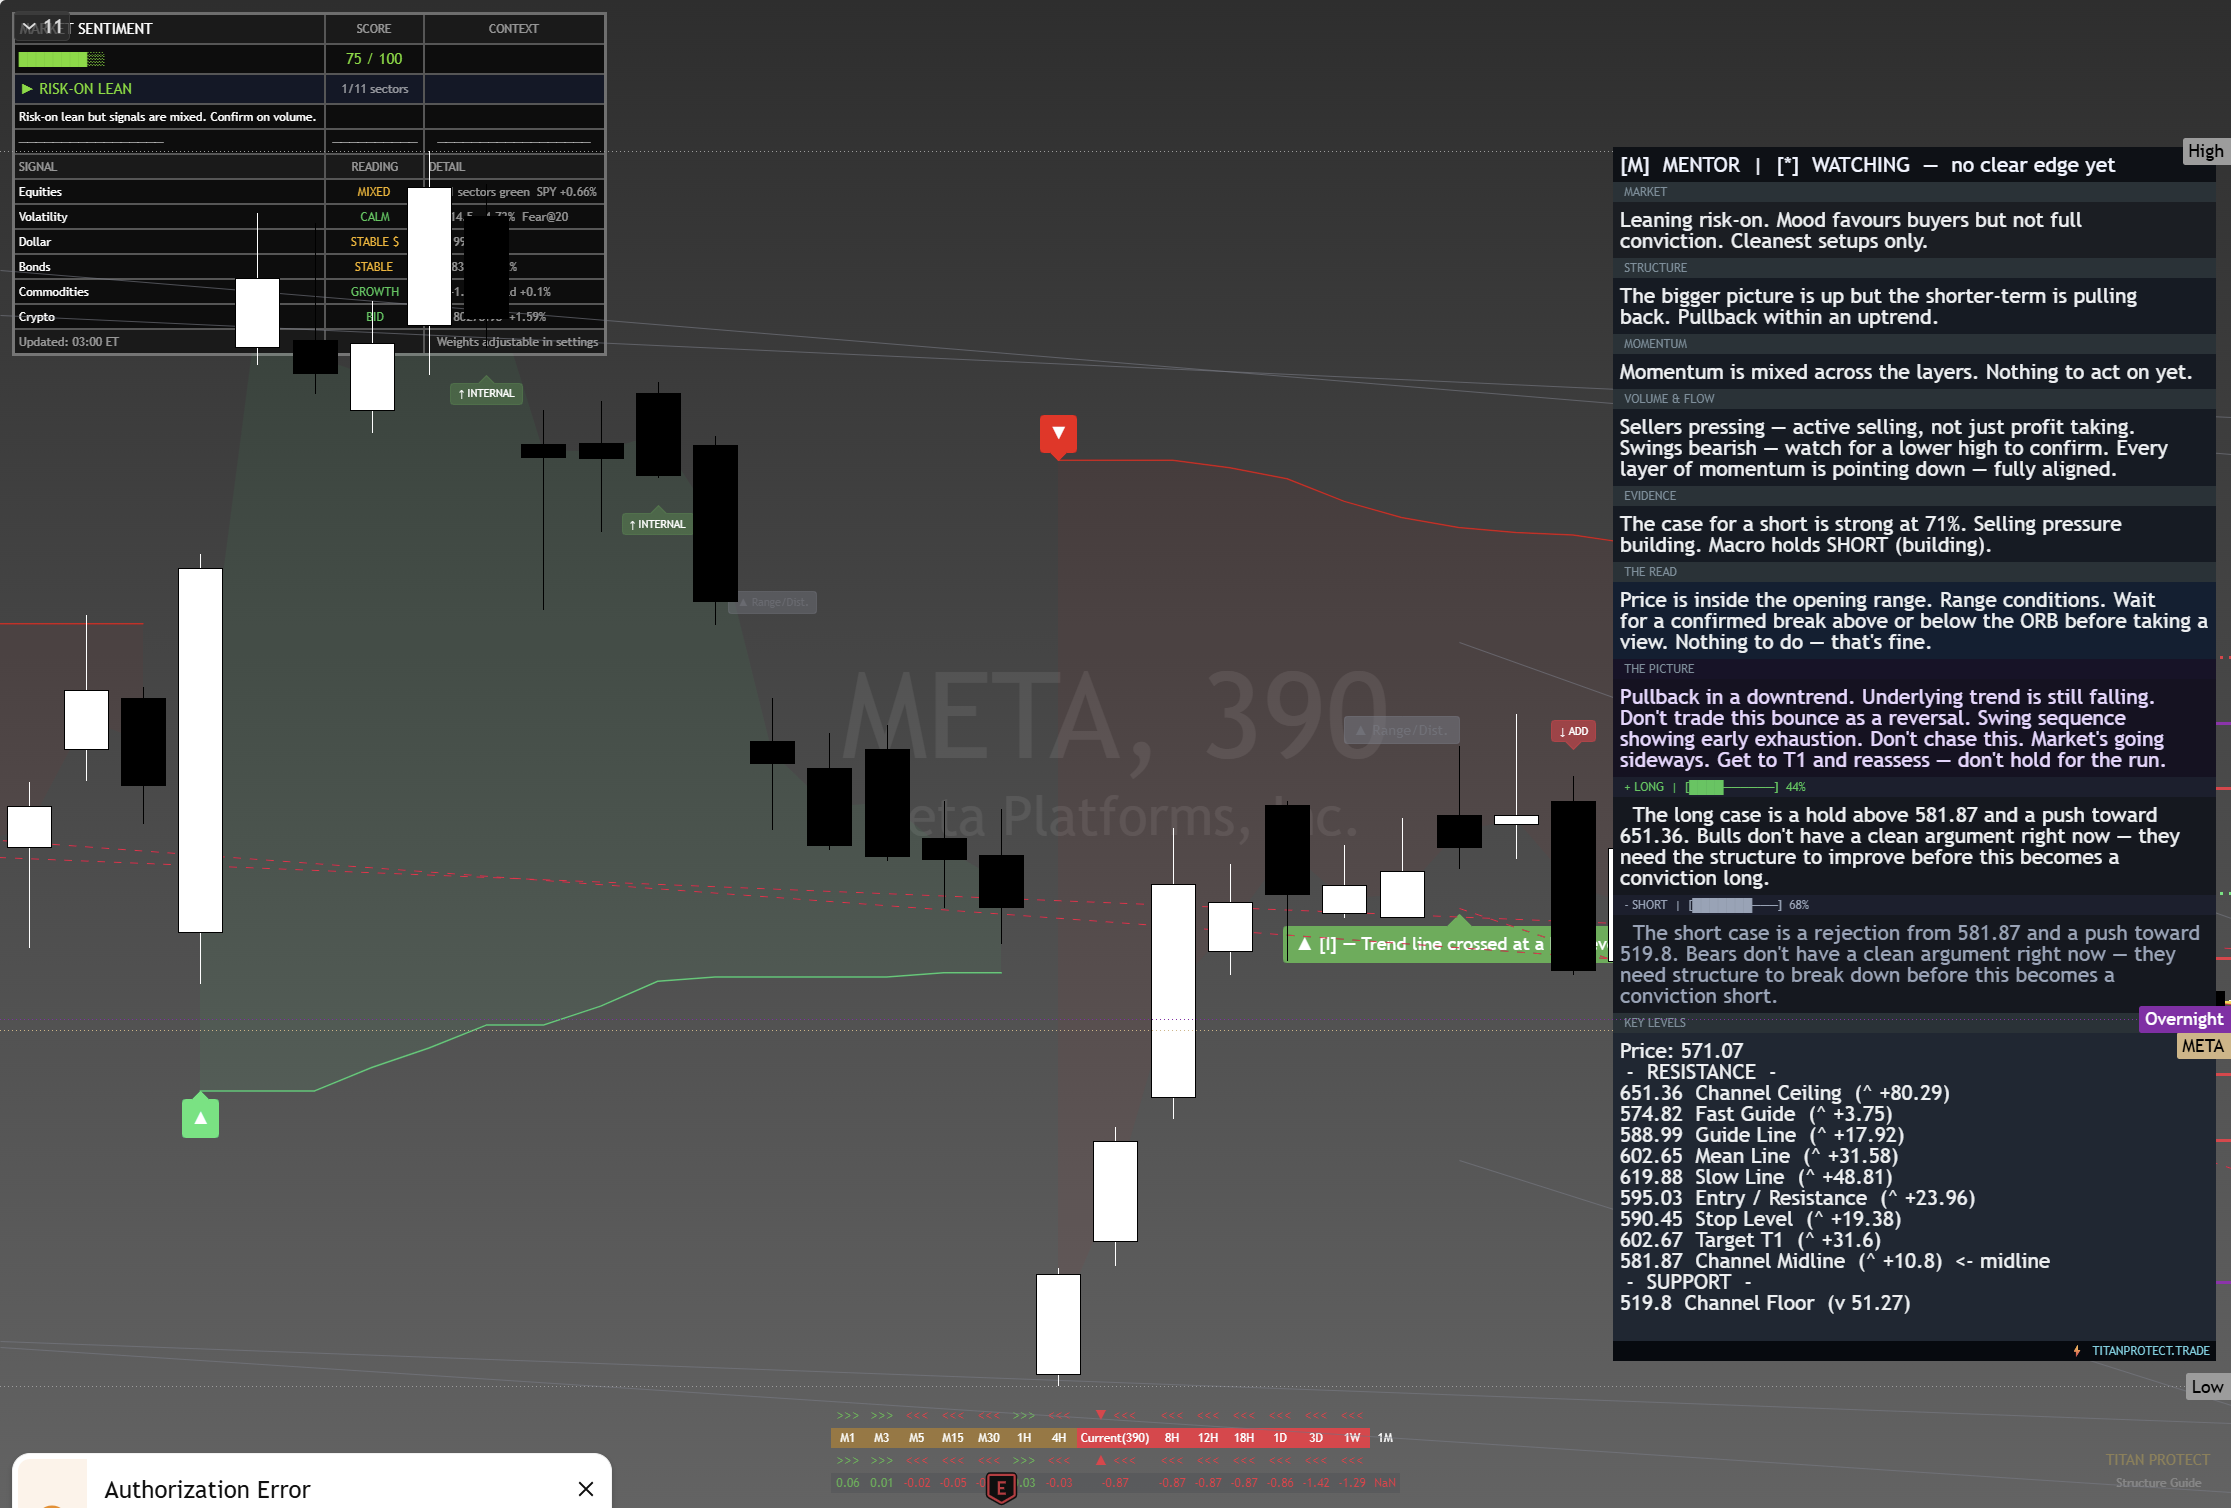
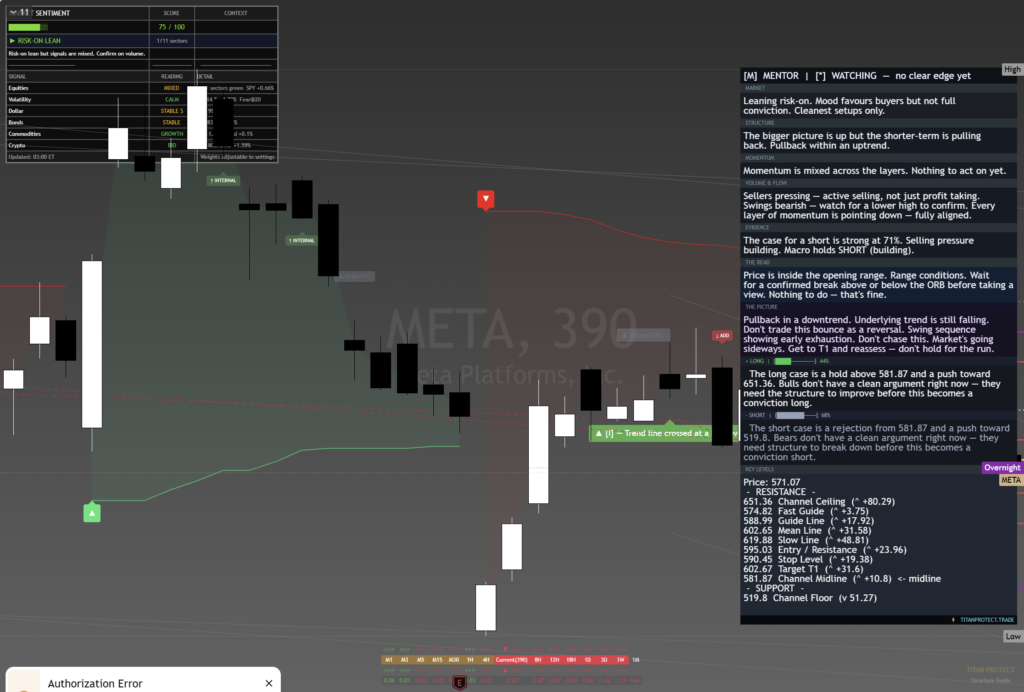
The chart above is the full daily read: structure, momentum, the levels that matter, and where the current price sits against them. Read it top to bottom for the complete picture, and pair it with our session briefs for the wider market context.
This is analysis, not financial advice. It reflects our multi-factor framework and is not a recommendation to buy or sell. Always do your own research and manage your risk.



