Nasdaq 100 (NAS100) – Daily Read
20 July 2026 | Index | Titan Macro Desk
Last Price
28,625.8
28,625.8
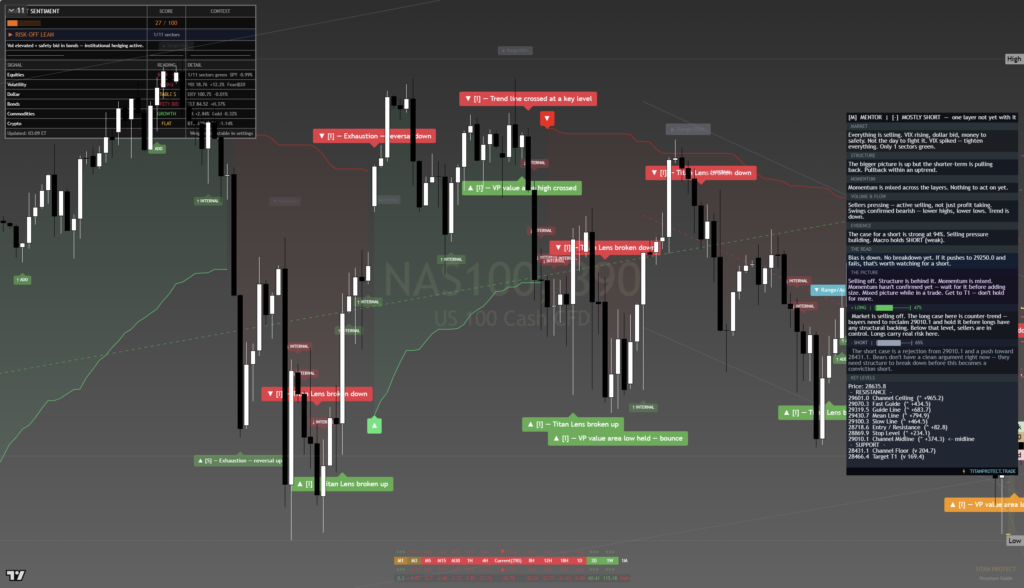
Equity indices open the week defensive after Friday’s chip-led drop, with the Nasdaq still below its 29,000 pivot and the market waiting on Wednesday’s mega-cap earnings before it commits either way.
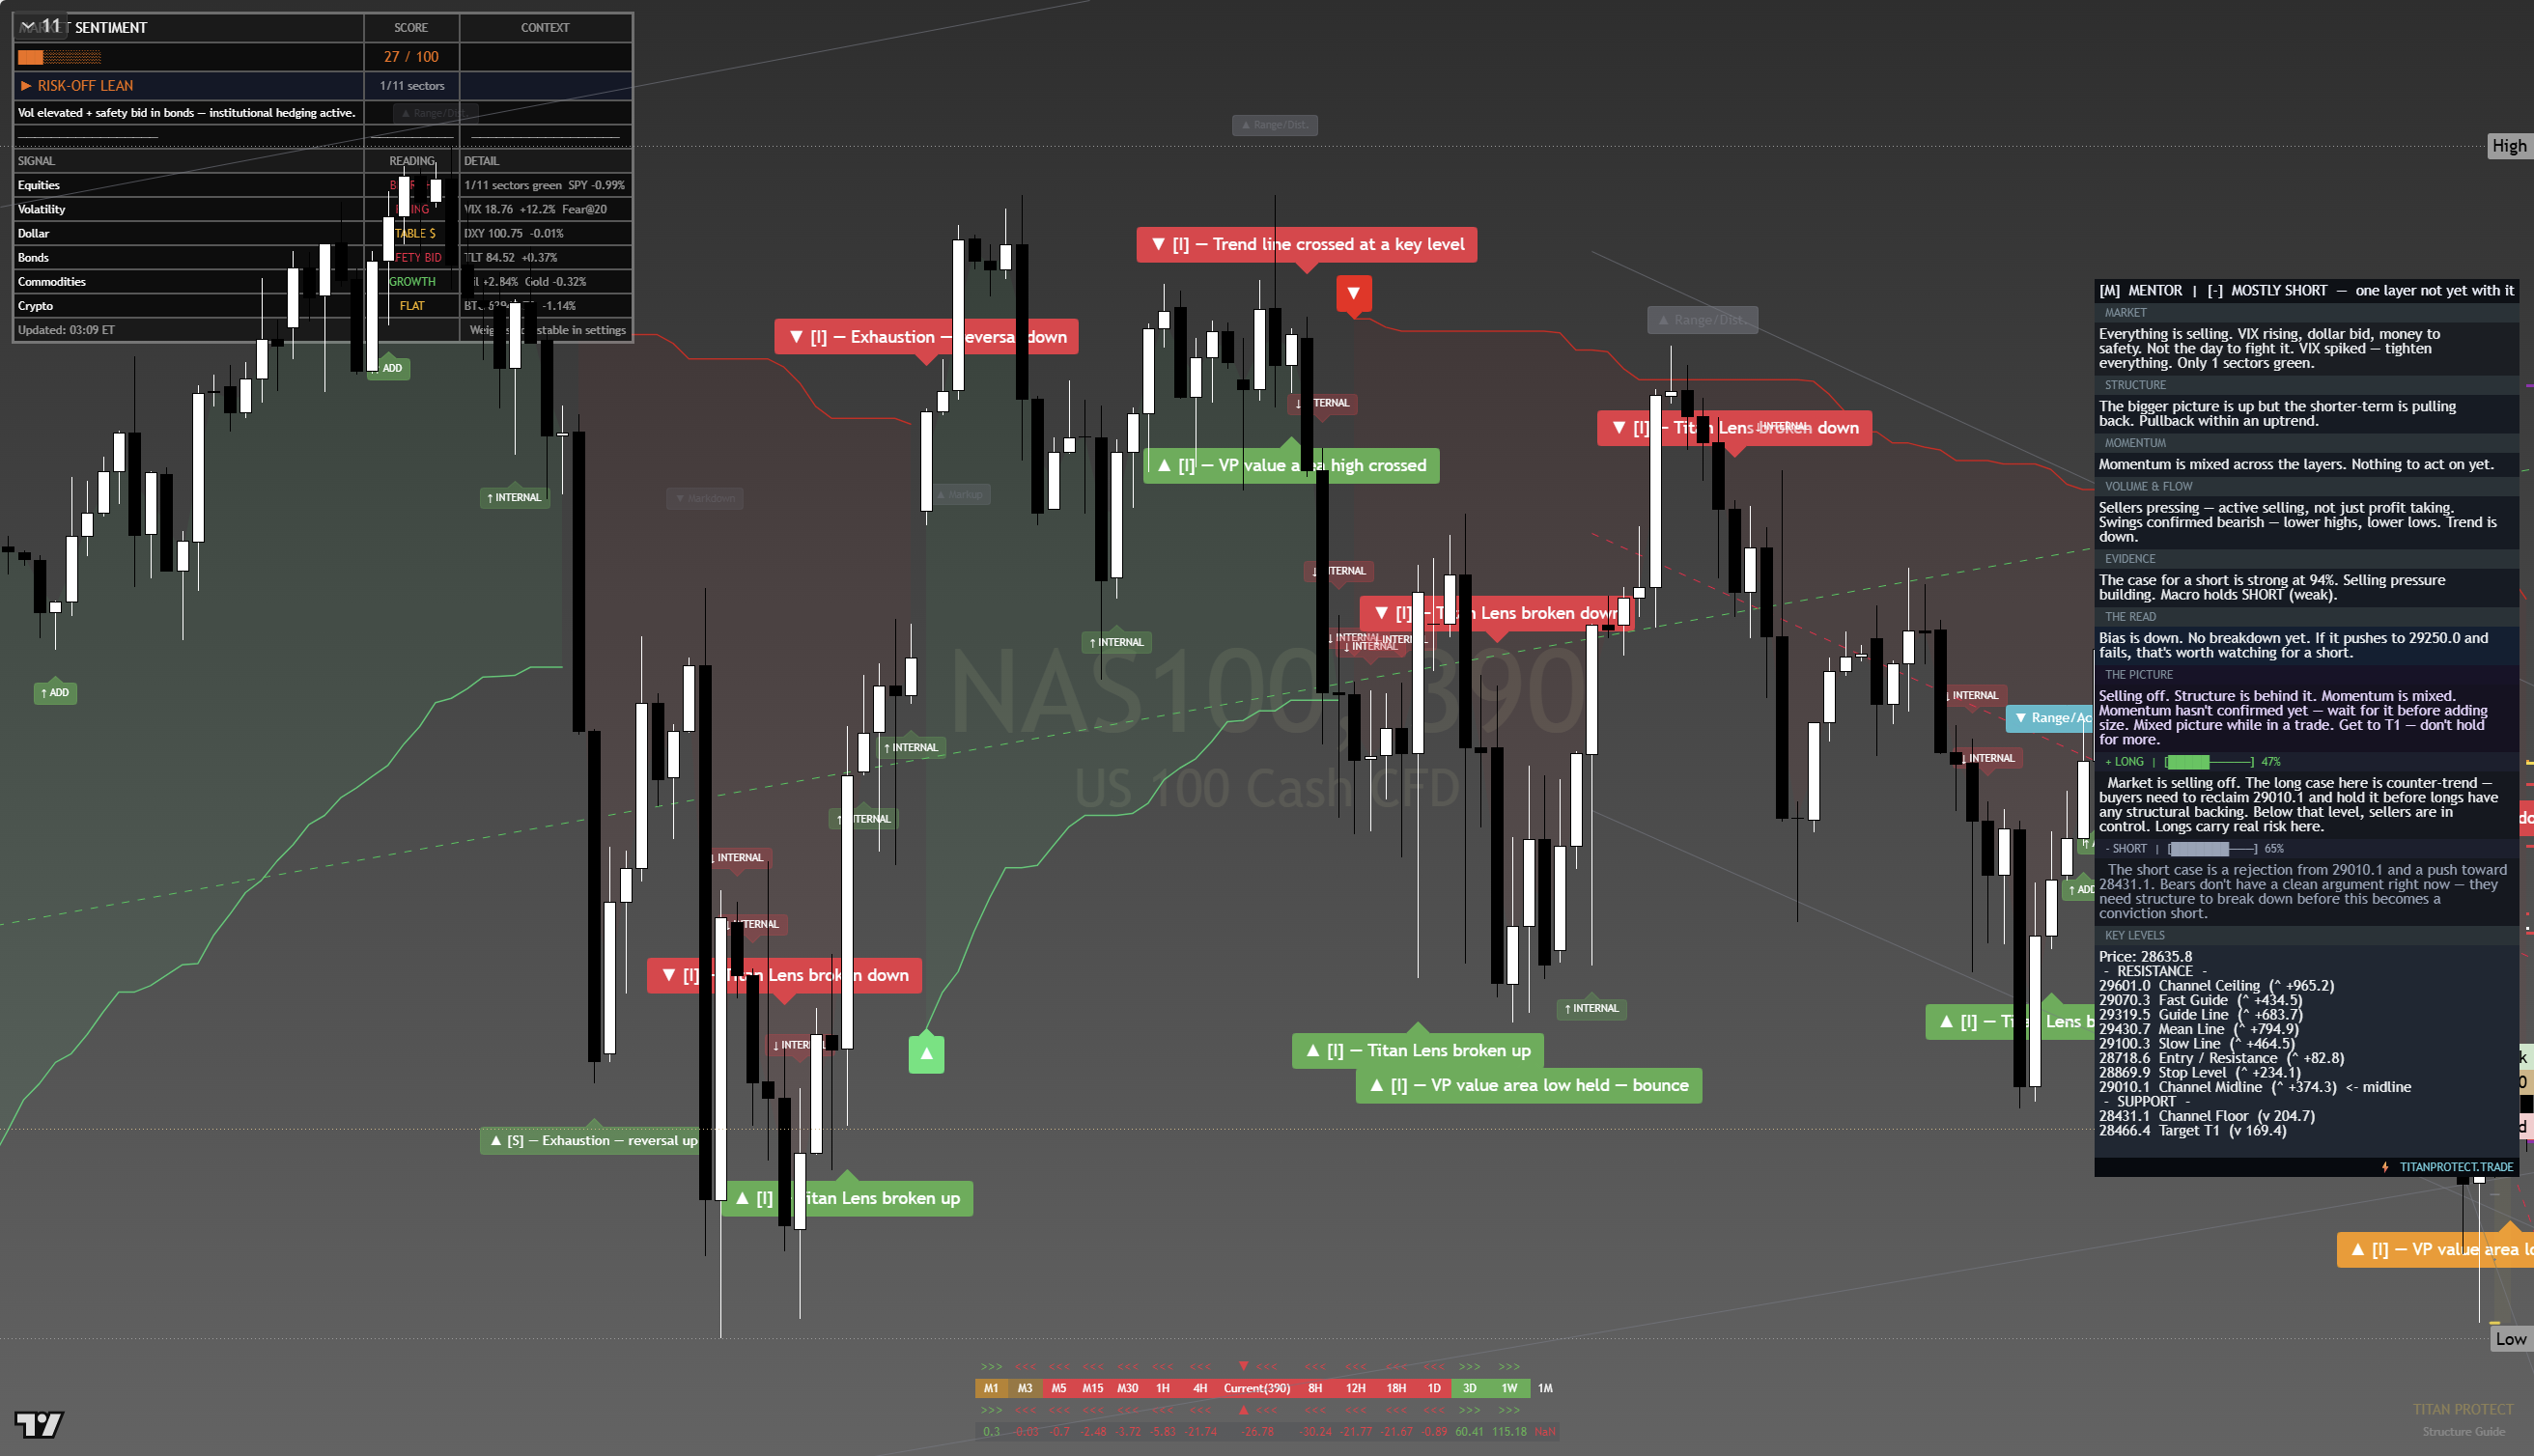
The chart above is the full framework read: structure, momentum, the levels that matter, and where the current price sits against them. Read it top to bottom for the complete picture, and pair it with our session briefs for the wider market context.
This is analysis, not financial advice. It reflects our multi-factor framework and is not a recommendation to buy or sell. Always do your own research and manage your risk.